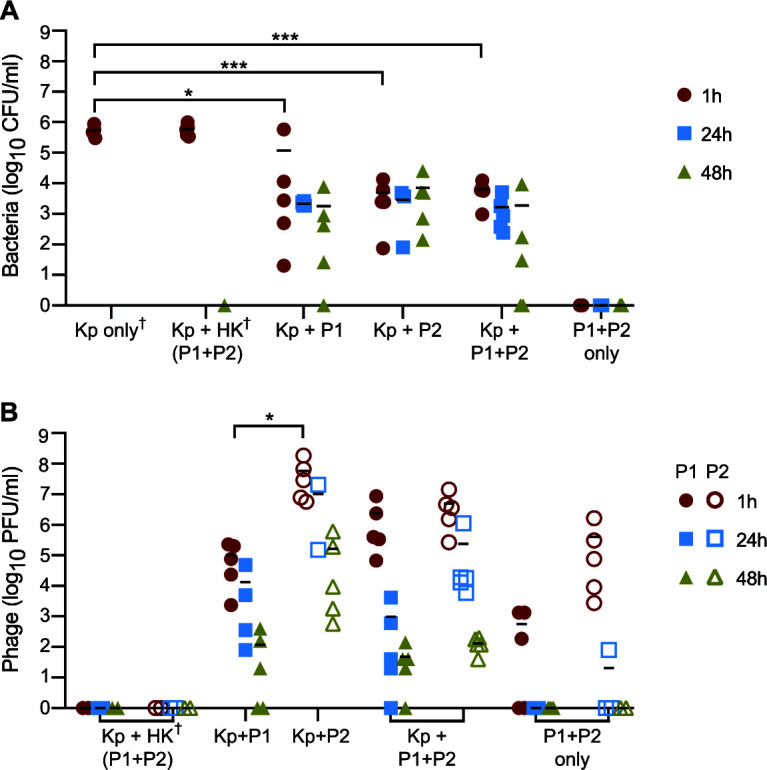
FIG 4.

Quantitation of bacteria and phage in mouse blood. (A and B) Bacterial CFU and phage PFU in mouse blood at 1 h, 24 h, and 48 h after phage treatment. Each symbol represents data from a single mouse, up to 5 per treatment group per time point. Bars denote group means. Samples for which no CFU or PFU was recovered are plotted as 0 on the x axis. †, Groups in which blood collection occurred at 12 h instead of 24 h or 48 h due to rapid disease progression. For these groups, bacteria in the blood were estimated to exceed 106 CFU/ml at 12 h but could not be accurately quantified. *, P < 0.05; ***, P < 0.001 as determined using a one-way ANOVA and Tukey’s posttest. Kp, K. pneumoniae ST258; P1, Pharr; P2, ϕKpNIH-2; HK, heat-killed.
