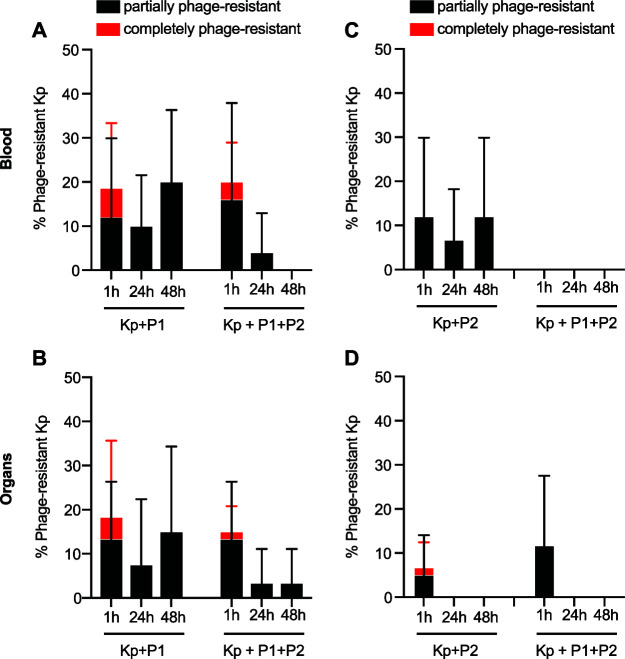
FIG 5.
Development of bacterial resistance to phage in blood and tissue. (A to D) Percentage of bacterial isolates recovered from blood (A and C) or tissue (B and D) that demonstrated complete or partial resistance to phage P1 (A and B) or P2 (C and D). Up to five bacterial isolates per mouse were tested for phage resistance using a cross-streak assay, equating to a maximum of 25 isolates (A and C) or 15 isolates (B and D) represented per bar. Data are presented as the mean ± standard deviation. Kp, K. pneumoniae ST258; P1, Pharr; P2, ϕKpNIH-2.

