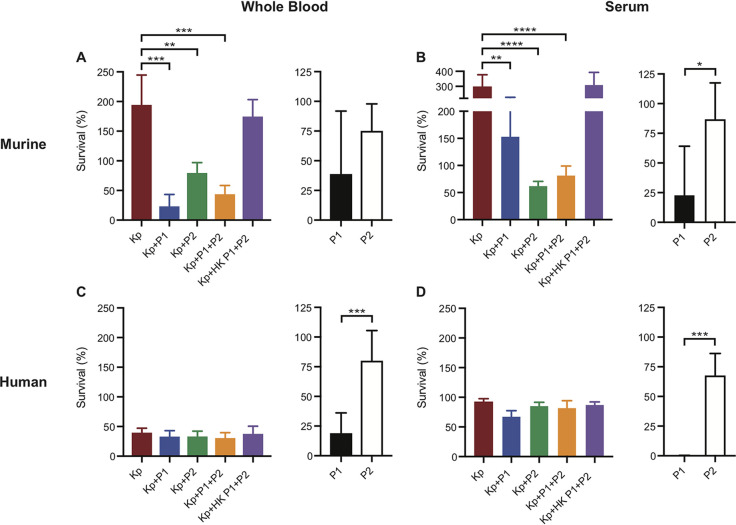
FIG 6.
Bacteria and phage survival in whole blood and serum. (A and C) (Left) Percentage bacterial recovery after 1 h of incubation with phage at an MOI of 1 or sterile saline (Kp only) in heparinized murine (A) and human (C) whole blood. (Right) Percentage phage recovery after 1 h of incubation in heparinized murine (A) and human (C) whole blood (no bacteria added). (B and D) In vitro assay from panels A and C performed in murine (B) and human (D) serum. Data are presented as the mean ± standard deviation. P values were determined using a one-way ANOVA and Dunnett’s posttest (left side, panels A and B) or by unpaired two-tailed t test (right side, black and white bars). *, P < 0.05; **, P < 0.01; ***, P < 0.001; ****, P < 0.0001. Kp, K. pneumoniae ST258; P1, Pharr; P2, ϕKpNIH-2; HK, heat-killed.

