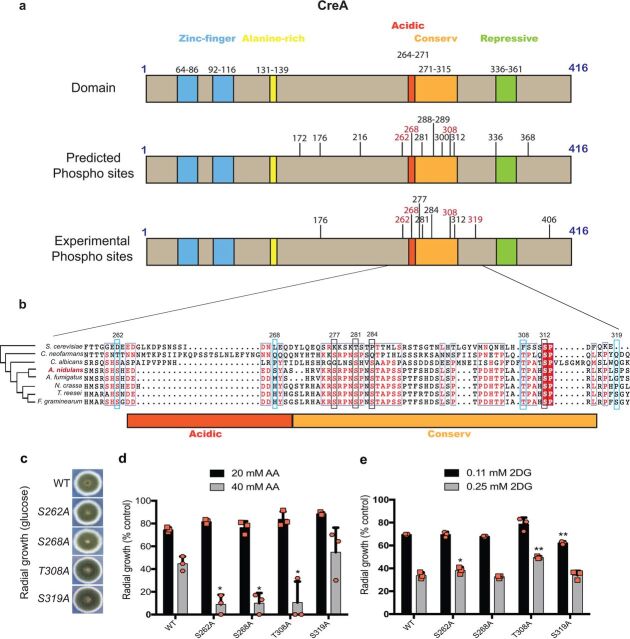
FIG 1.
Diagram of CreA protein domains and phosphorylation sites. (a) Schematic diagrams of CreA protein domains. The top shows CreA protein domains and their localization: zinc fingers (blue), alanine rich (yellow), acidic (dark orange), conserved (light orange), and repressive (green). The middle shows CreA phosphorylation sites, as predicted by NetPhos3.1 on the entire length of the protein. The bottom shows CreA phosphorylation sites, as identified by nLC-MS/MS, when the wild-type strain was exposed to 2% (wt/vol) glucose for 30 min. In red are the sites that were experimentally confirmed in this work. (b) Alignment of A. nidulans CreA and homologues of different fungi (yeast and filamentous). The phylogenetic tree shows the closeness between proteins from each fungus; conserved regions are shown in red inside the boxes, and a red box means conserved in all organisms. Highlighted in blue are the phosphorylation sites characterized in this work; highlighted in black are additional phosphosites that were experimentally identified. (c) Strains were grown from 105 spores on glucose minimal medium (MM) for 5 days. Graphs representing radial growth (colony diameter) of strains in glucose (d) or xylose minimal medium (MM) supplemented with increased concentrations of 2DG (2-deoxyglucose) and AA (allyl alcohol) (e). Growth is given as the percentage normalized to the control (without 2DG, AA) condition for each strain. Standard deviations represent the averages from three biological replicates (depicted in orange). *, P < 0.05; **, P < 0.001 in a two-way ANOVA multiple-comparison test using the WT (wild-type) strain as a reference for each condition.

