
FIG 2.
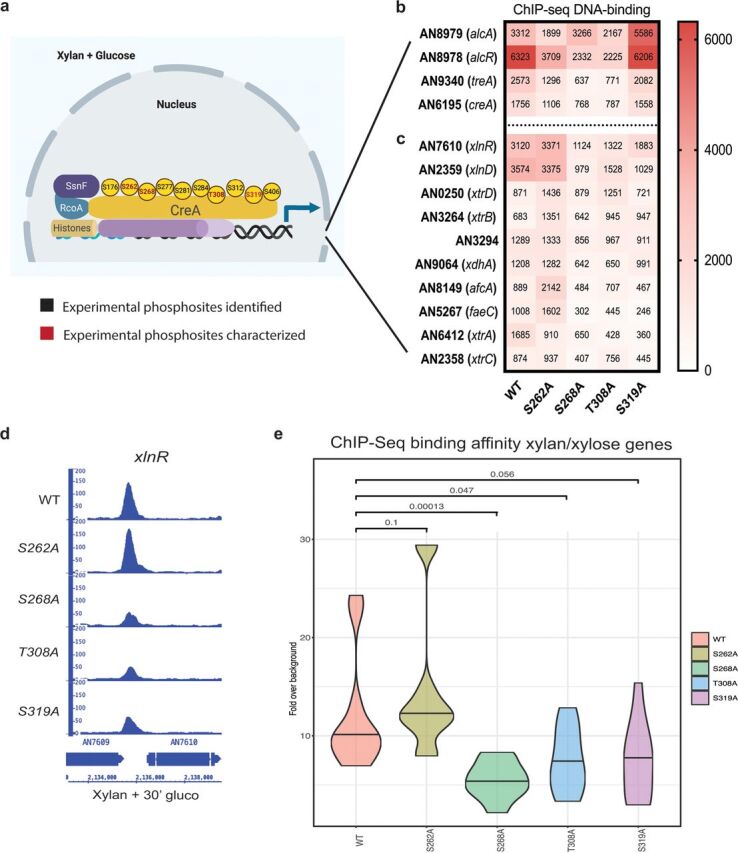
Summary of CreA phosphomutant phenotypes. (a) Diagram showing CreA protein localization and experimental phosphorylation sites identified by nLC-MS/MS, when the wild-type strain was incubated in minimal medium supplemented with 2% (wt/vol) glucose for 30 min. Experimentally identified CreA phosphosites are shown in black, and the four here-characterized phosphosites are shown in red. Heat map of CreA-GFP binding affinities, as determined by ChIP-seq under the same condition as described for panel a in the WT, S262A, S268A, T308A, and S319A strains showing creA and genes involved in alcohol and trehalose metabolism (b) and xylan/xylose metabolism (DNA-binding affinity average of three replicates is shown as a number in the center of each square) (c). (d) Integrative genome viewer of the xlnR promoter region showing reduced DNA-binding affinity in the S268A, T308A, and S319A strains. (e) Average CreA-GFP DNA-binding affinity, as identified by ChIP-seq, for all xylan/xylose genes in each CreA phosphomutation-harboring strain. Statistical analyses via two-way ANOVA multiple-comparison test using the WT as a reference.