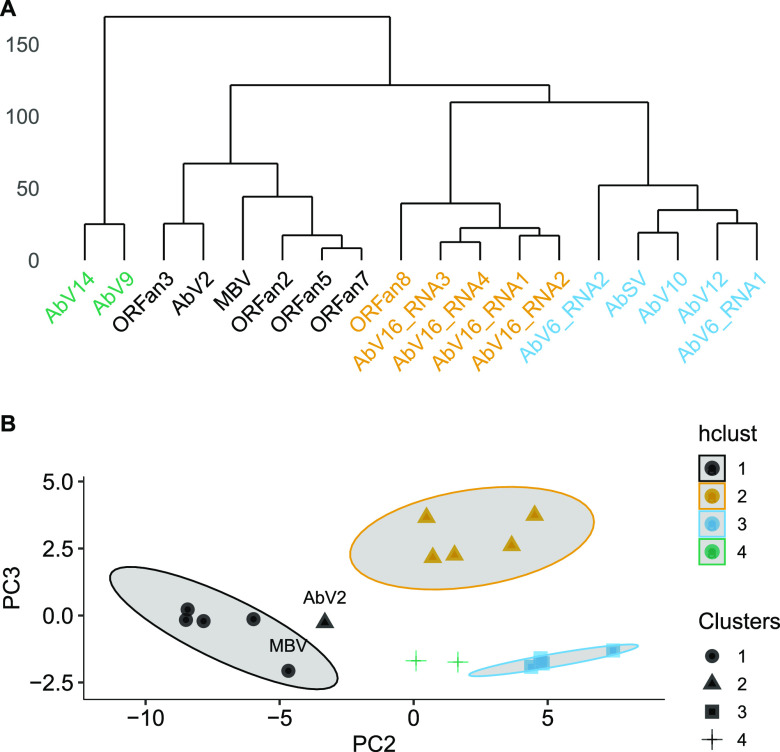
FIG 1.
Viral abundance clustering. (A) Hierarchical cluster dendrogram computed on the Euclidean distance between RNA abundances using Ward's minimum variance method (45). (B) Principal component plot (PC2 versus PC3) of RNA abundances. Shapes indicate clusters identified with k-medoids clustering, and point colors indicate hierarchical clusters derived from panel A. The shaded area indicates the 85% confidence levels of each (hierarchical) cluster.

