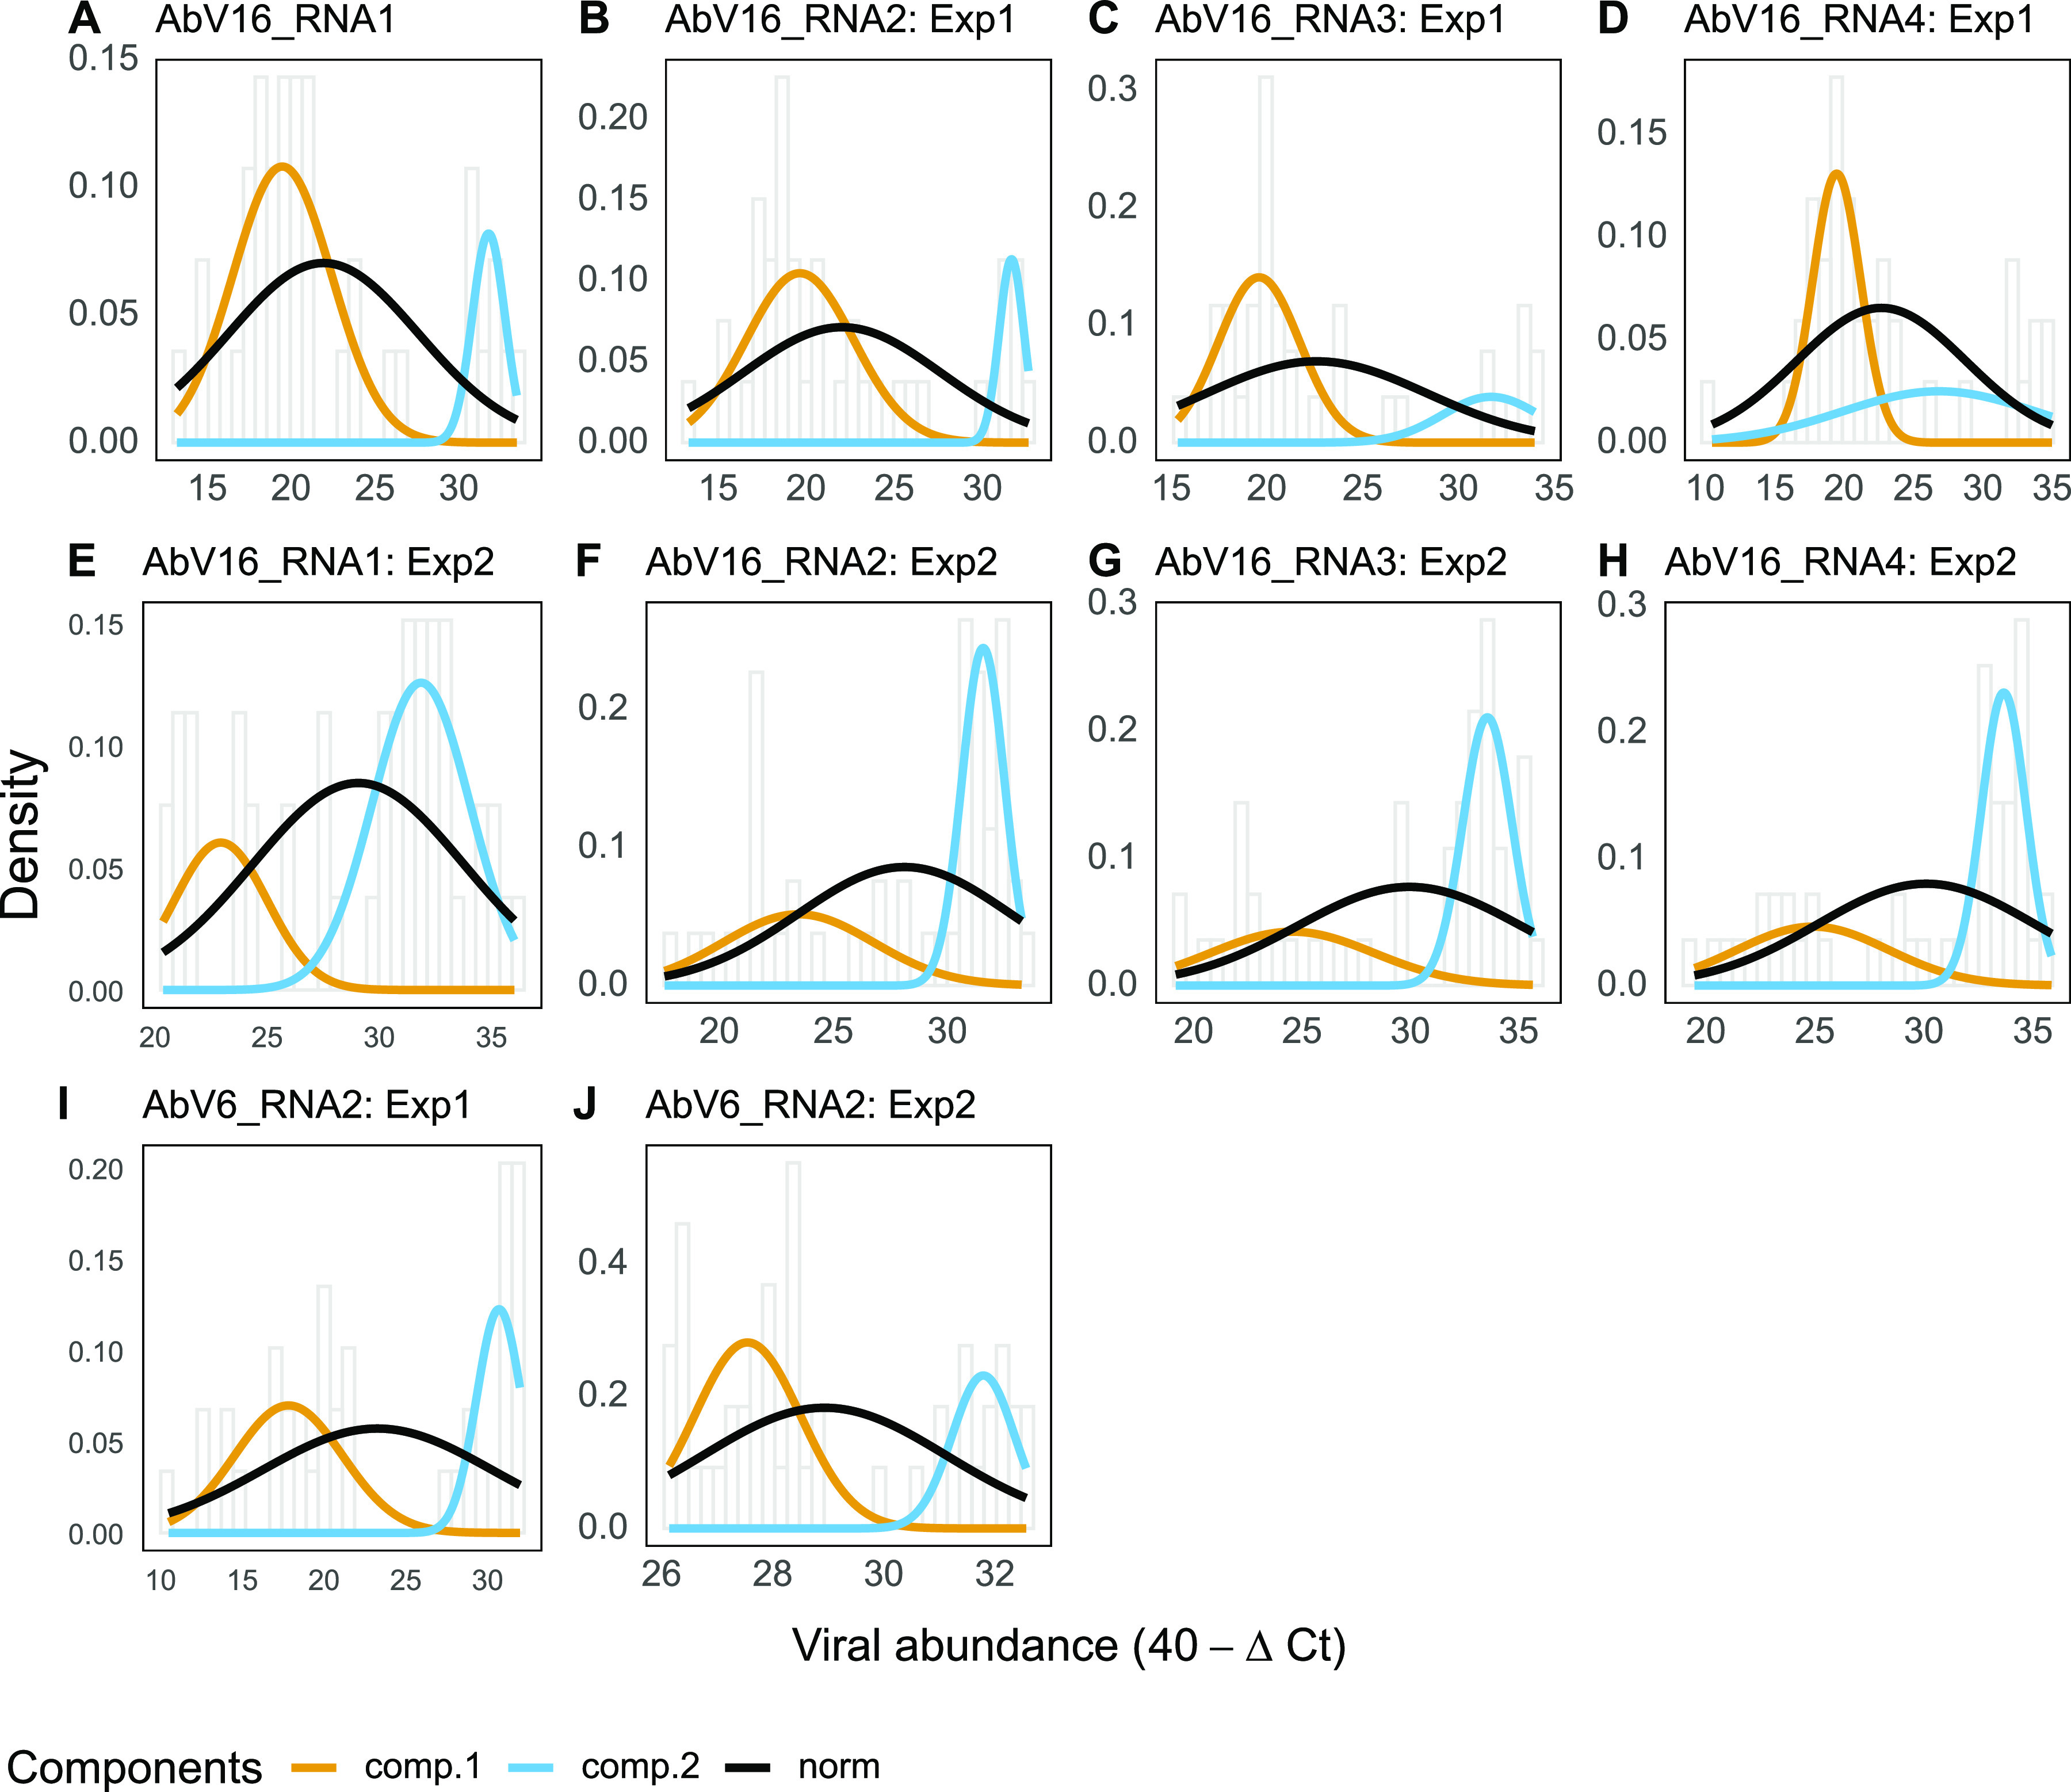
FIG 4.

Best-fit normal models for viral RNA abundance in each experiment. Each graph shows a histogram of the viral abundance with bin width of 0.5 and normal (norm) and double normal (comp.1 and comp.2) curves. The double normal distribution model was fitted to the abundance of the named viral RNA (A to J) using expectation maximization, specifically by maximizing the conditional expected complete data log likelihood per viral abundance measurement (log likelihood and P values are given in Table S2 in the supplemental material).
