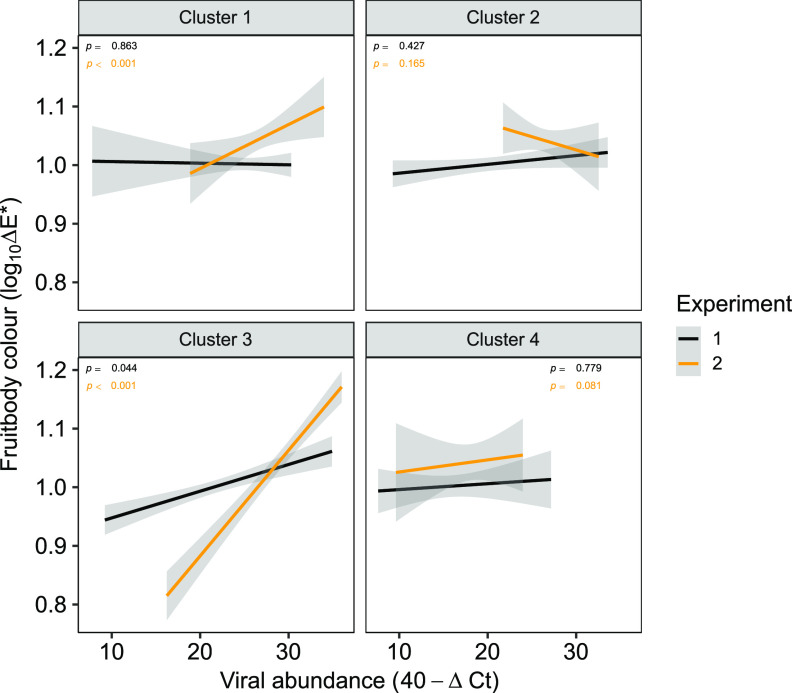
FIG 5.
Cap color and viral abundance correlation in each viral cluster. High ΔE* values denote a brown color cap, and the ΔCT values have undergone a 40−ΔCT transformation so that higher 40−ΔCT values equate to high levels of viral RNA. P values are calculated from Pearson’s correlation coefficients. Trend lines were fitted using linear least-squares regression. Shaded areas around the lines indicate the 0.95 confidence interval.

