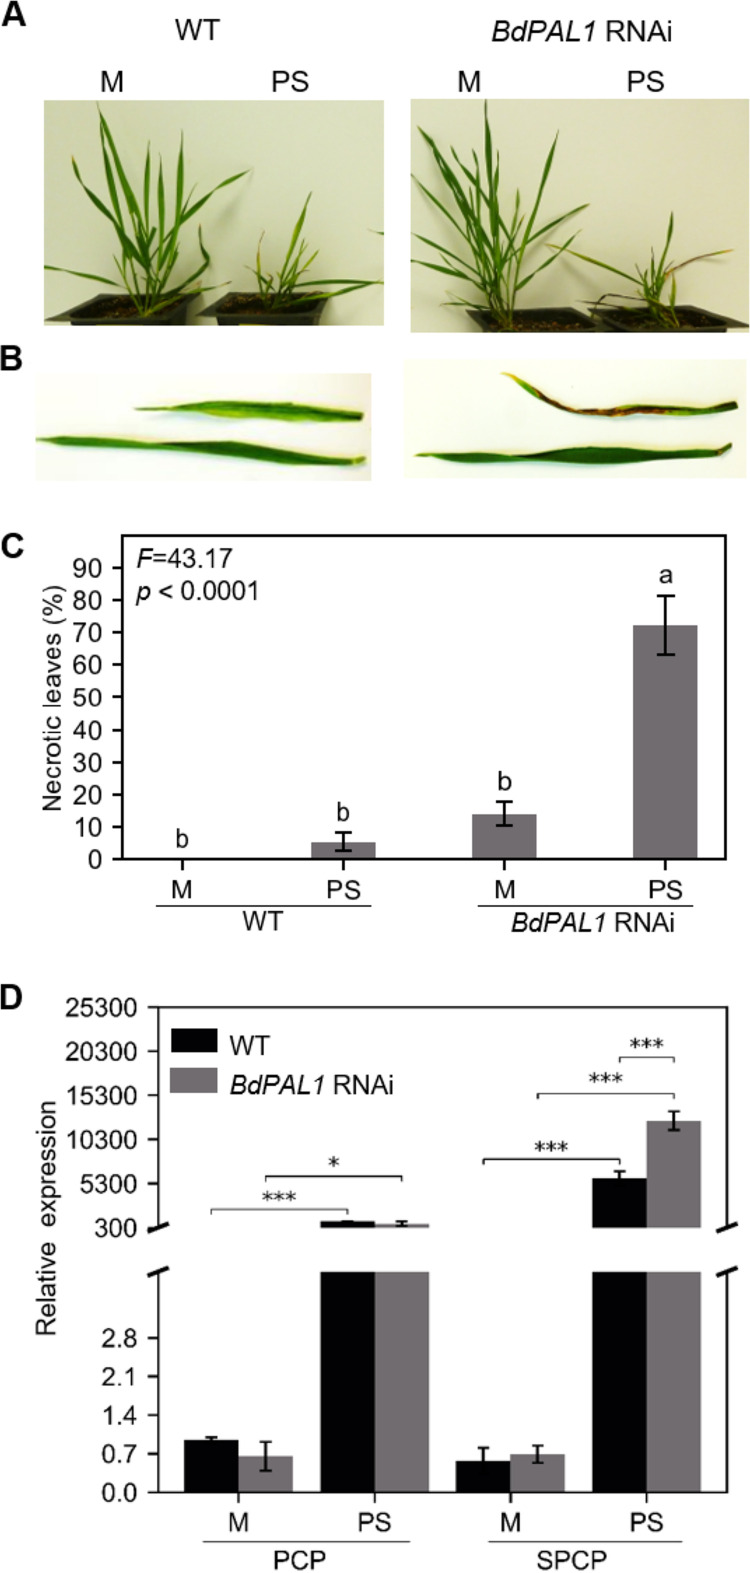
FIG 5.
BdPAL1 RNAi plants showed enhanced susceptibility to PMV+SPMV infection. (A) Mock- and PMV+SPMV-infected WT (left) and BdPAL1 RNAi (right) plants at stage III (21 dpi). (B) Closeup of mock- and PMV+SPMV-infected leaves of WT (left) and BdPAL1 RNAi (right) plants at stage III (21 dpi). (C) Percentages of leaves with necrosis of wild-type (WT) and BdPAL1 RNAi plants, mock- and virus-infected plants at stage III (21 dpi). Statistically significant differences were assessed using one-way ANOVA followed by the Tukey’s multiple-comparison test. Unlike lowercase letters represent significant differences among the group means (P ≤ 0.05). F statistics of ANOVA are indicated. (D) RT-qPCR detection of mRNA encoding PMV CP (PCP) and SPMV CP (SPCP) in noninoculated leaves at 14 dpi. M, mock; PS, PMV+SPMV. Statistically significant differences were assessed between mock- and virus-inoculated samples using two-sample t test (one-tailed). *, P ≤ 0.05; ***, P ≤ 0.001. The error bars represent standard errors of the means (n = 3).

