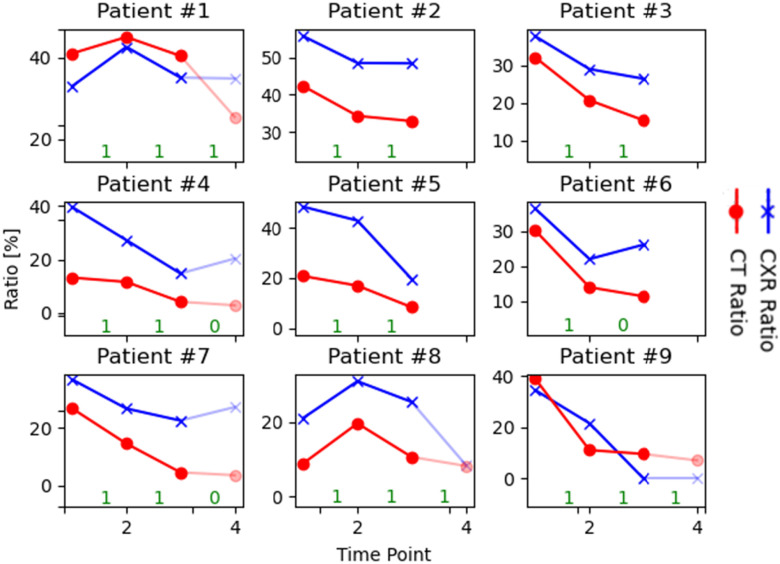
Fig. 13.
Comparison of patient monitoring using the pneumonia ratios computed from CT volumes and the corresponding DRRs. The numbers in green (on the x-axis) represent the agreement between change trends of CXR and CT ratios that were used to calculate the accuracy of change. Interval between time points 3-4 is shaded out to reflect mild disease states based on the CT.

