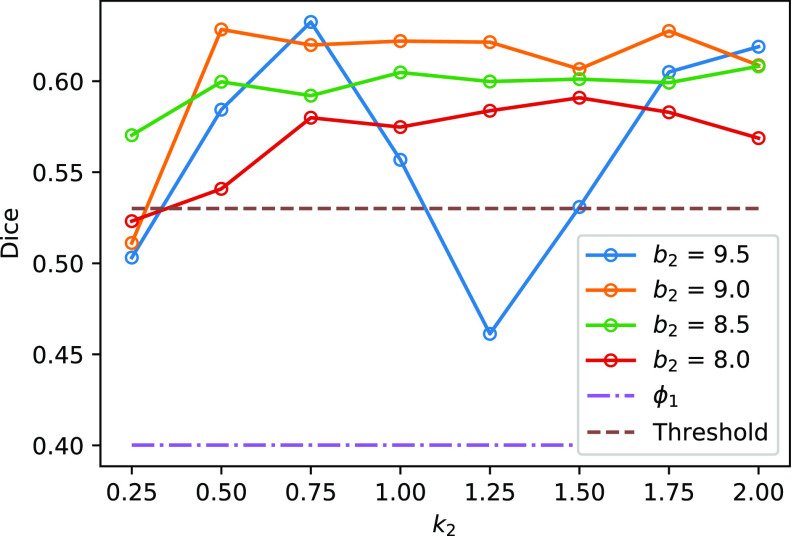
Fig. 3.
The Dice coefficient on the MedSeg dataset with different  and
and  . The solid lines with hollow points show the results with prior function
  . The purple dash-dotted line is the result from
  with
with  . The brown dashed line is the result from the thresholding with -200 HU. The
  values 9.5, 9.0, 8.5, 8.0 correspond to 21, -34, -89, and -144 HUs respectively.

