Fig. 5.

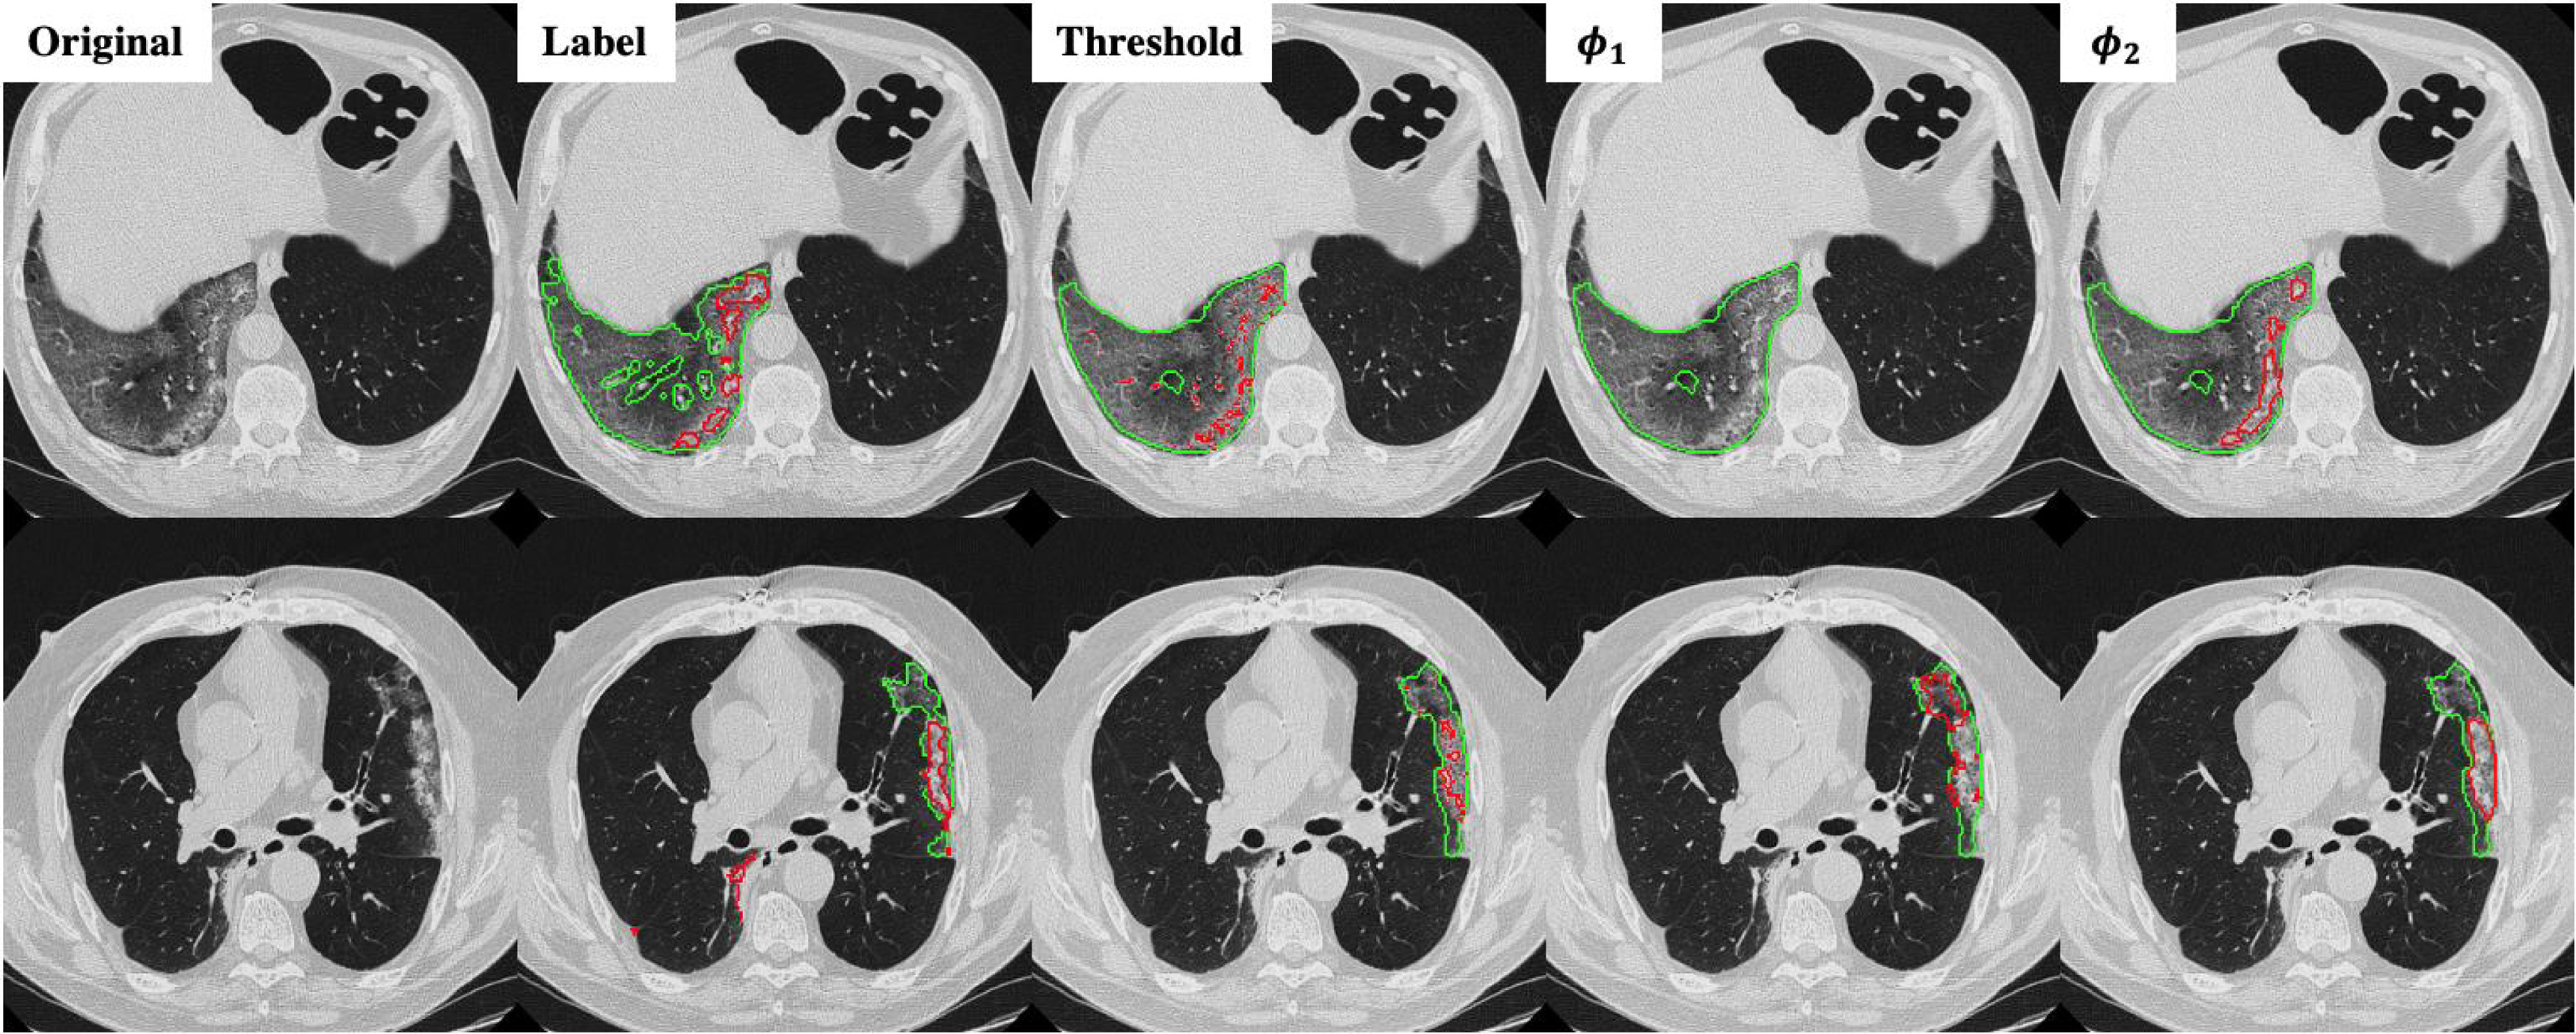
Infection and consolidation segmentation results on the MegSeg dataset for two different slices. Green lines show the boundary of GGO and read lines show the boundary of consolidation.

Infection and consolidation segmentation results on the MegSeg dataset for two different slices. Green lines show the boundary of GGO and read lines show the boundary of consolidation.