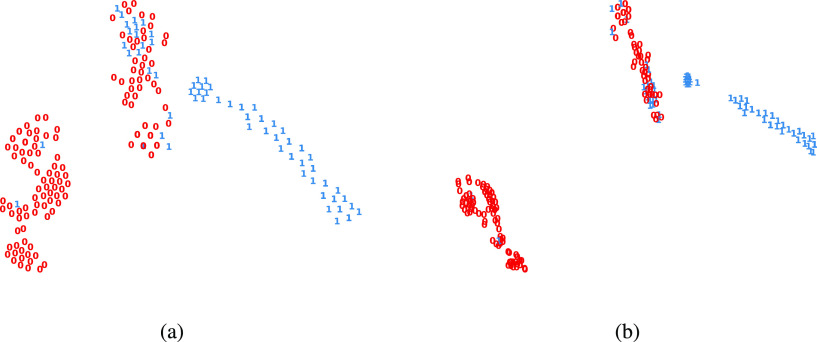
Fig. 7.
Representation visualizations by t-SNE [63]. Each case is visualized as one point, the infected and healthy cases are represented by 1 and 0, in color blue and red, respectively. (a) the visualization for the aggregated feature of each patient. (b) the visualization for the feature before final decision.

