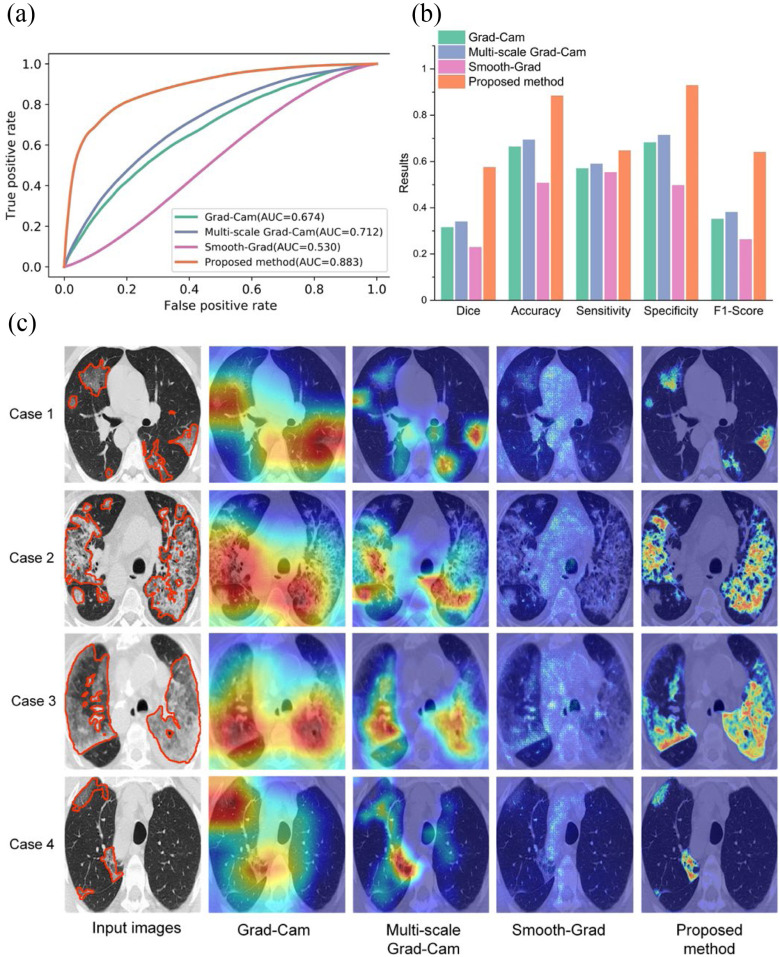
Fig. 3.
Comparing different weakly supervised learning methods in Testing Set 1. (a) The ROC curve of different weakly supervised learning methods for COVID-19 lesion localization. (b) Quantitative comparison of different weakly supervised learning methods. (c) Qualitative comparison of different weakly supervised learning methods. Lesions are denoted as orange color contours in the input images.

