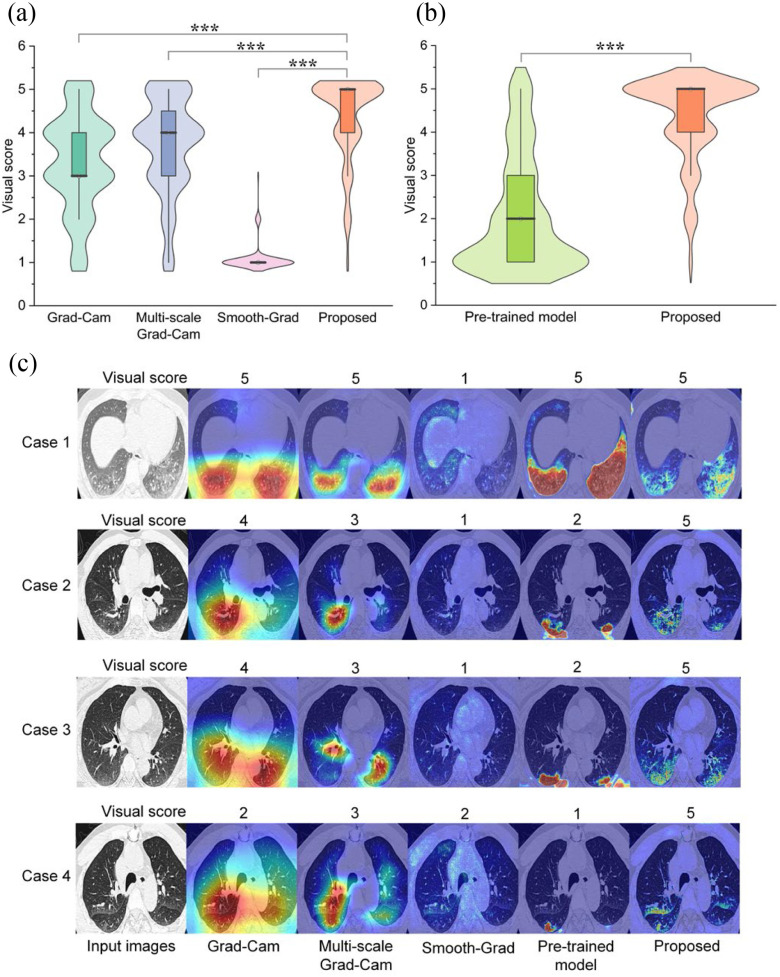
Fig. 6.
Comparison of visual score between different methods in Testing Set 2. (a) Quantitative comparison of different weakly supervised learning methods with a Student's t-test, *P < 0.05; **P < 0.01; ***P < 0.001. (b) Compared with pre-trained fully supervised learning model. (c) Qualitative comparison between different methods.

