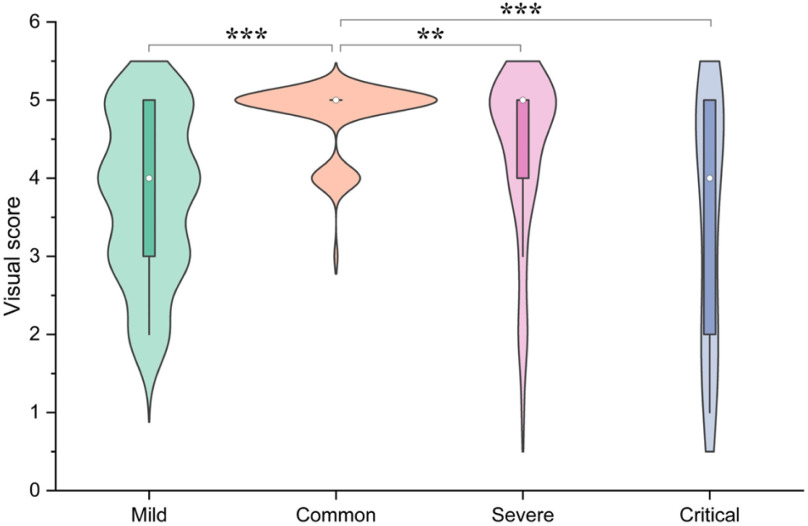
Fig. 7.
Correlation between severity and visual score. The severity was divided into mild, common, severe and critical according to the percentage of lesion to lung size (mild: percentage < 10%, common: 10% < percentage < 30%, severe: 30%< percentage < 50% and critical: percentage > 50%). We compared the visual score between common group and the other groups with a Student's t-test, *P < 0.05; **P < 0.01; ***P < 0.001.

