
Fig. 8.
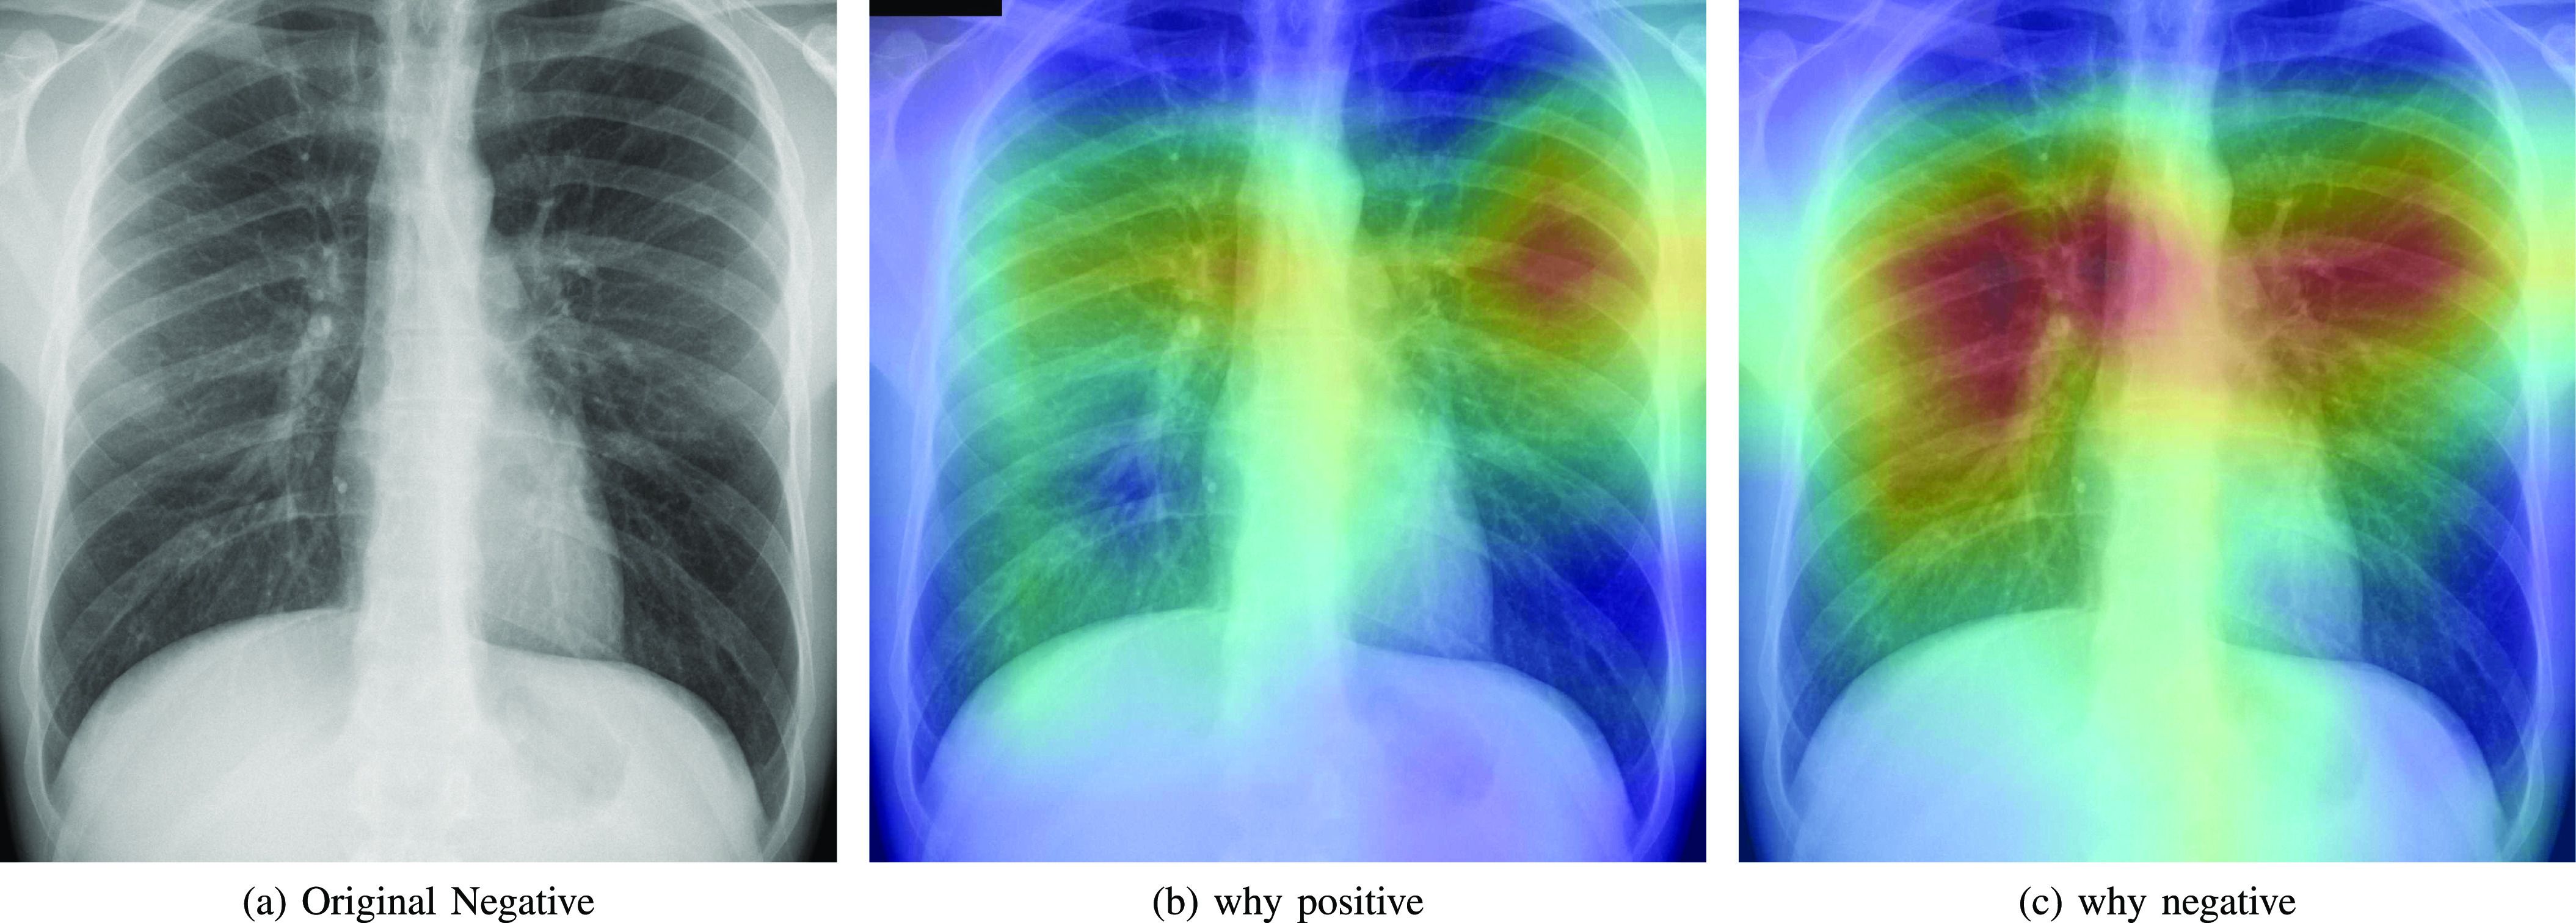
Heatmap that explains the parts of the input image that triggered the counterfactual explanation (b) and the negative actual prediction (c).
Official websites use .gov
A
.gov website belongs to an official
government organization in the United States.
Secure .gov websites use HTTPS
A lock (
) or https:// means you've safely
connected to the .gov website. Share sensitive
information only on official, secure websites.
Heatmap that explains the parts of the input image that triggered the counterfactual explanation (b) and the negative actual prediction (c).