FIGURE 6.

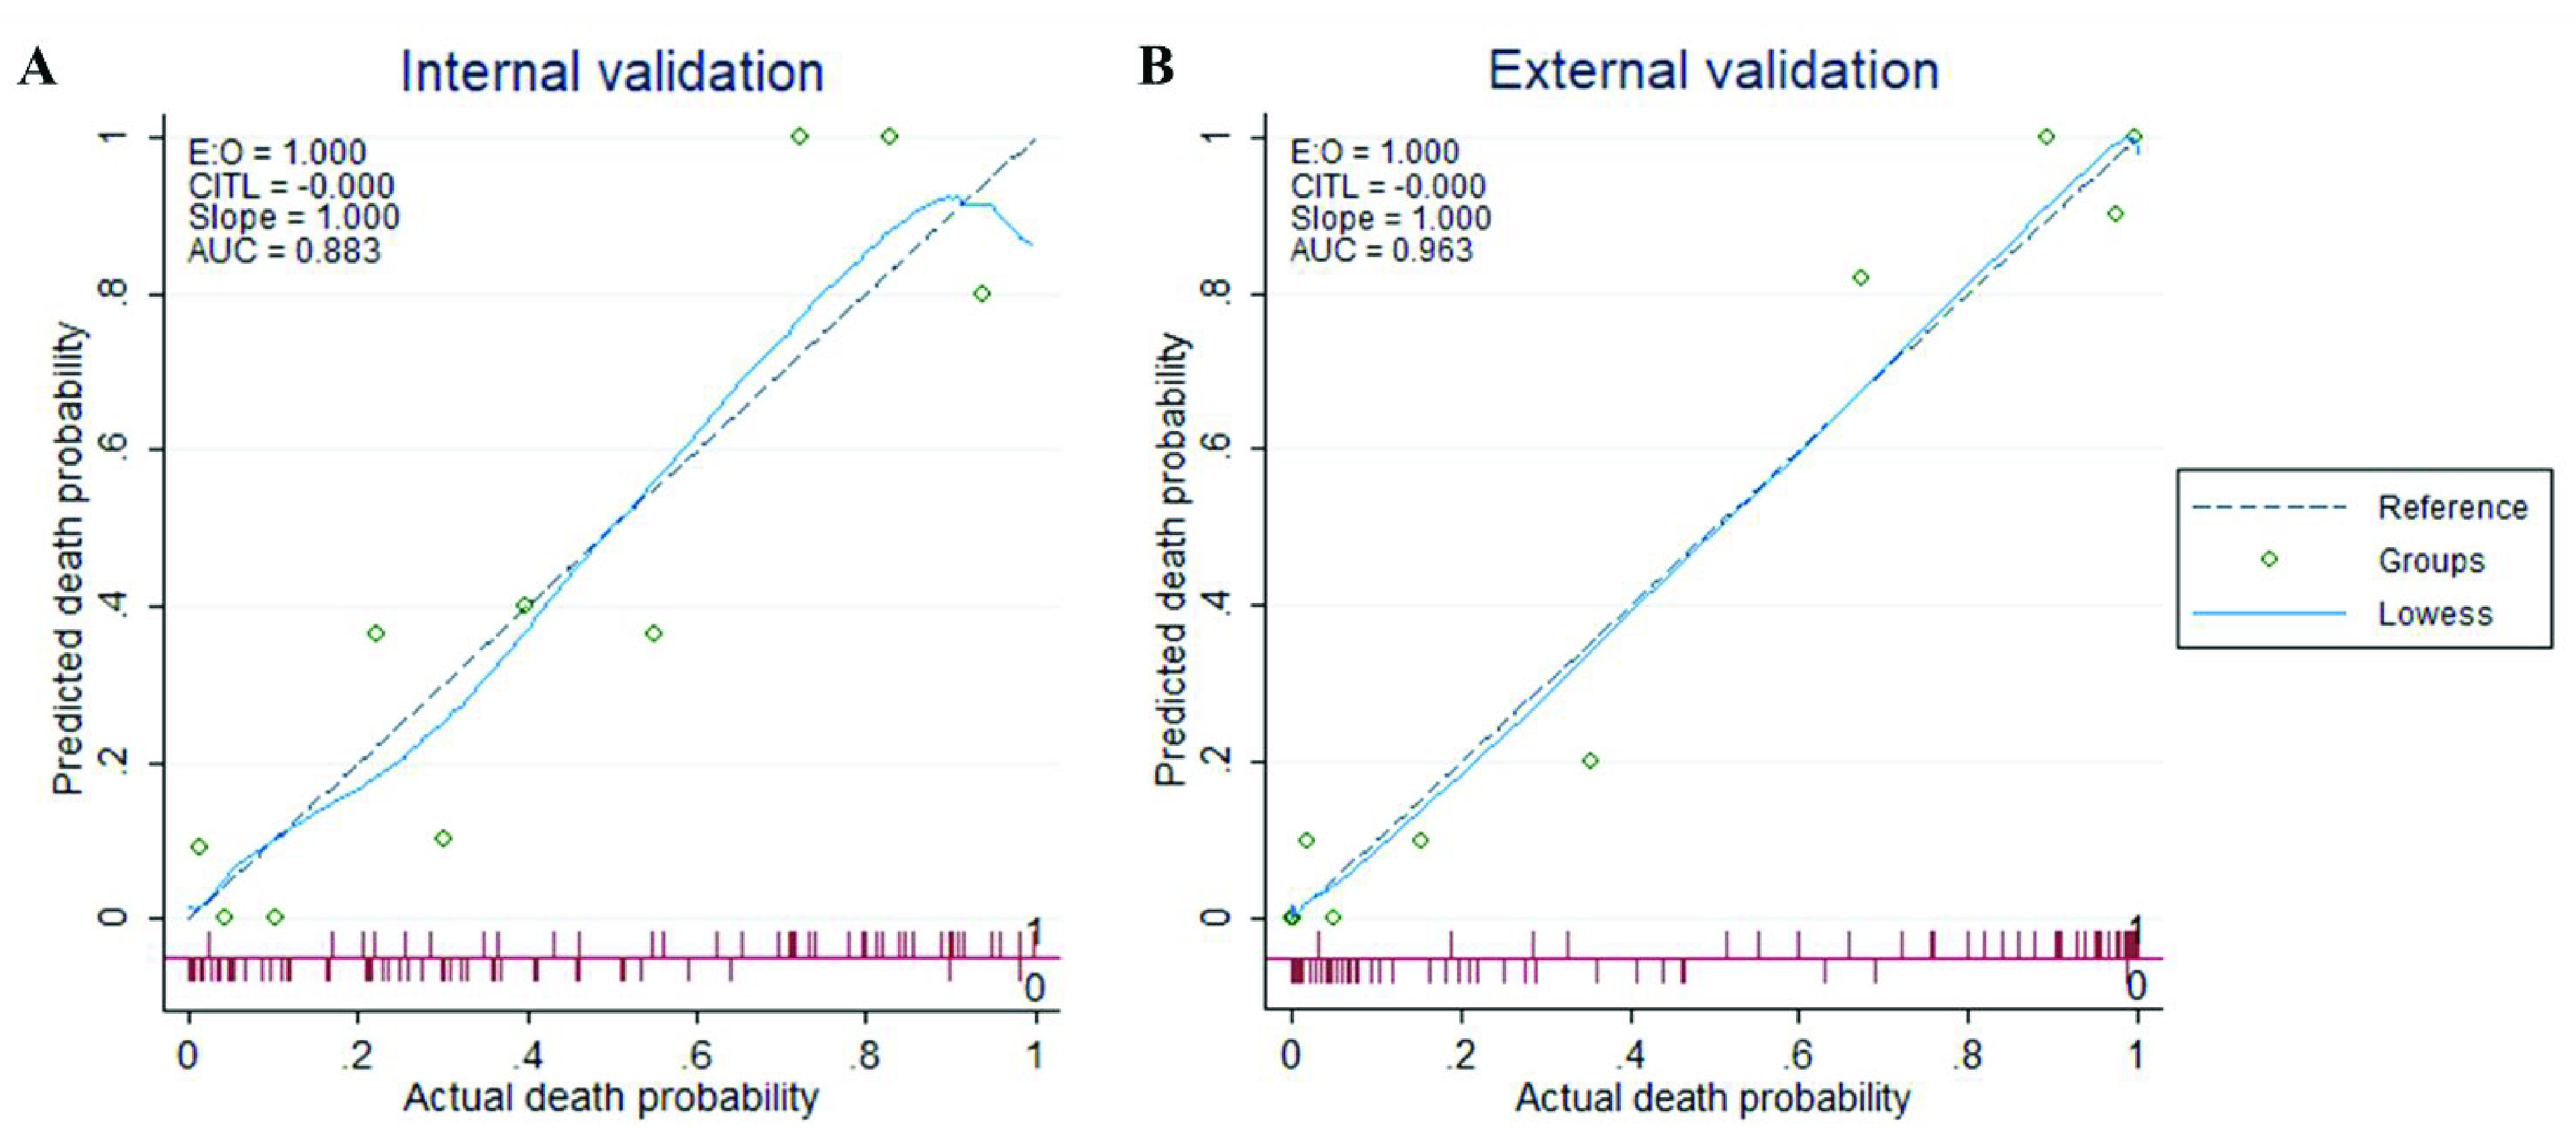
Calibration plot comparing predicted and actual death probability of patients with COVID-19: (A) represents the internal validation using Chinese test data, and (B) represents the external validation using Bangladeshi data.

Calibration plot comparing predicted and actual death probability of patients with COVID-19: (A) represents the internal validation using Chinese test data, and (B) represents the external validation using Bangladeshi data.