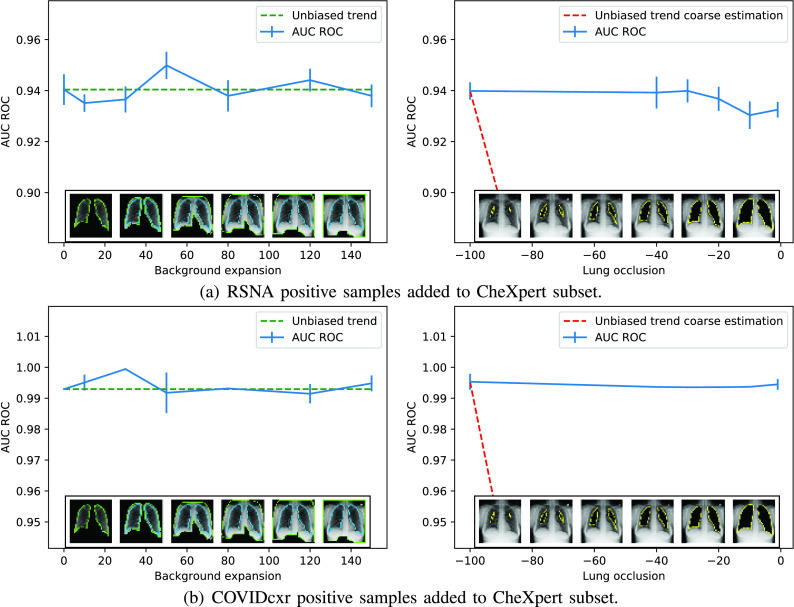
FIGURE 10.
Addition of positive samples from RSNA and COVIDcxr to CheXpert’s dataset. The green dotted lines mark the correct behavior of a non-biased dataset when more and more background is included, and the red dotted lines indicate the expected reduction of the classification rate as the lungs are removed from the analysis. Blue lines show the accuracy for a given expansion or reduction with a vertical line indicating the standard deviation.

