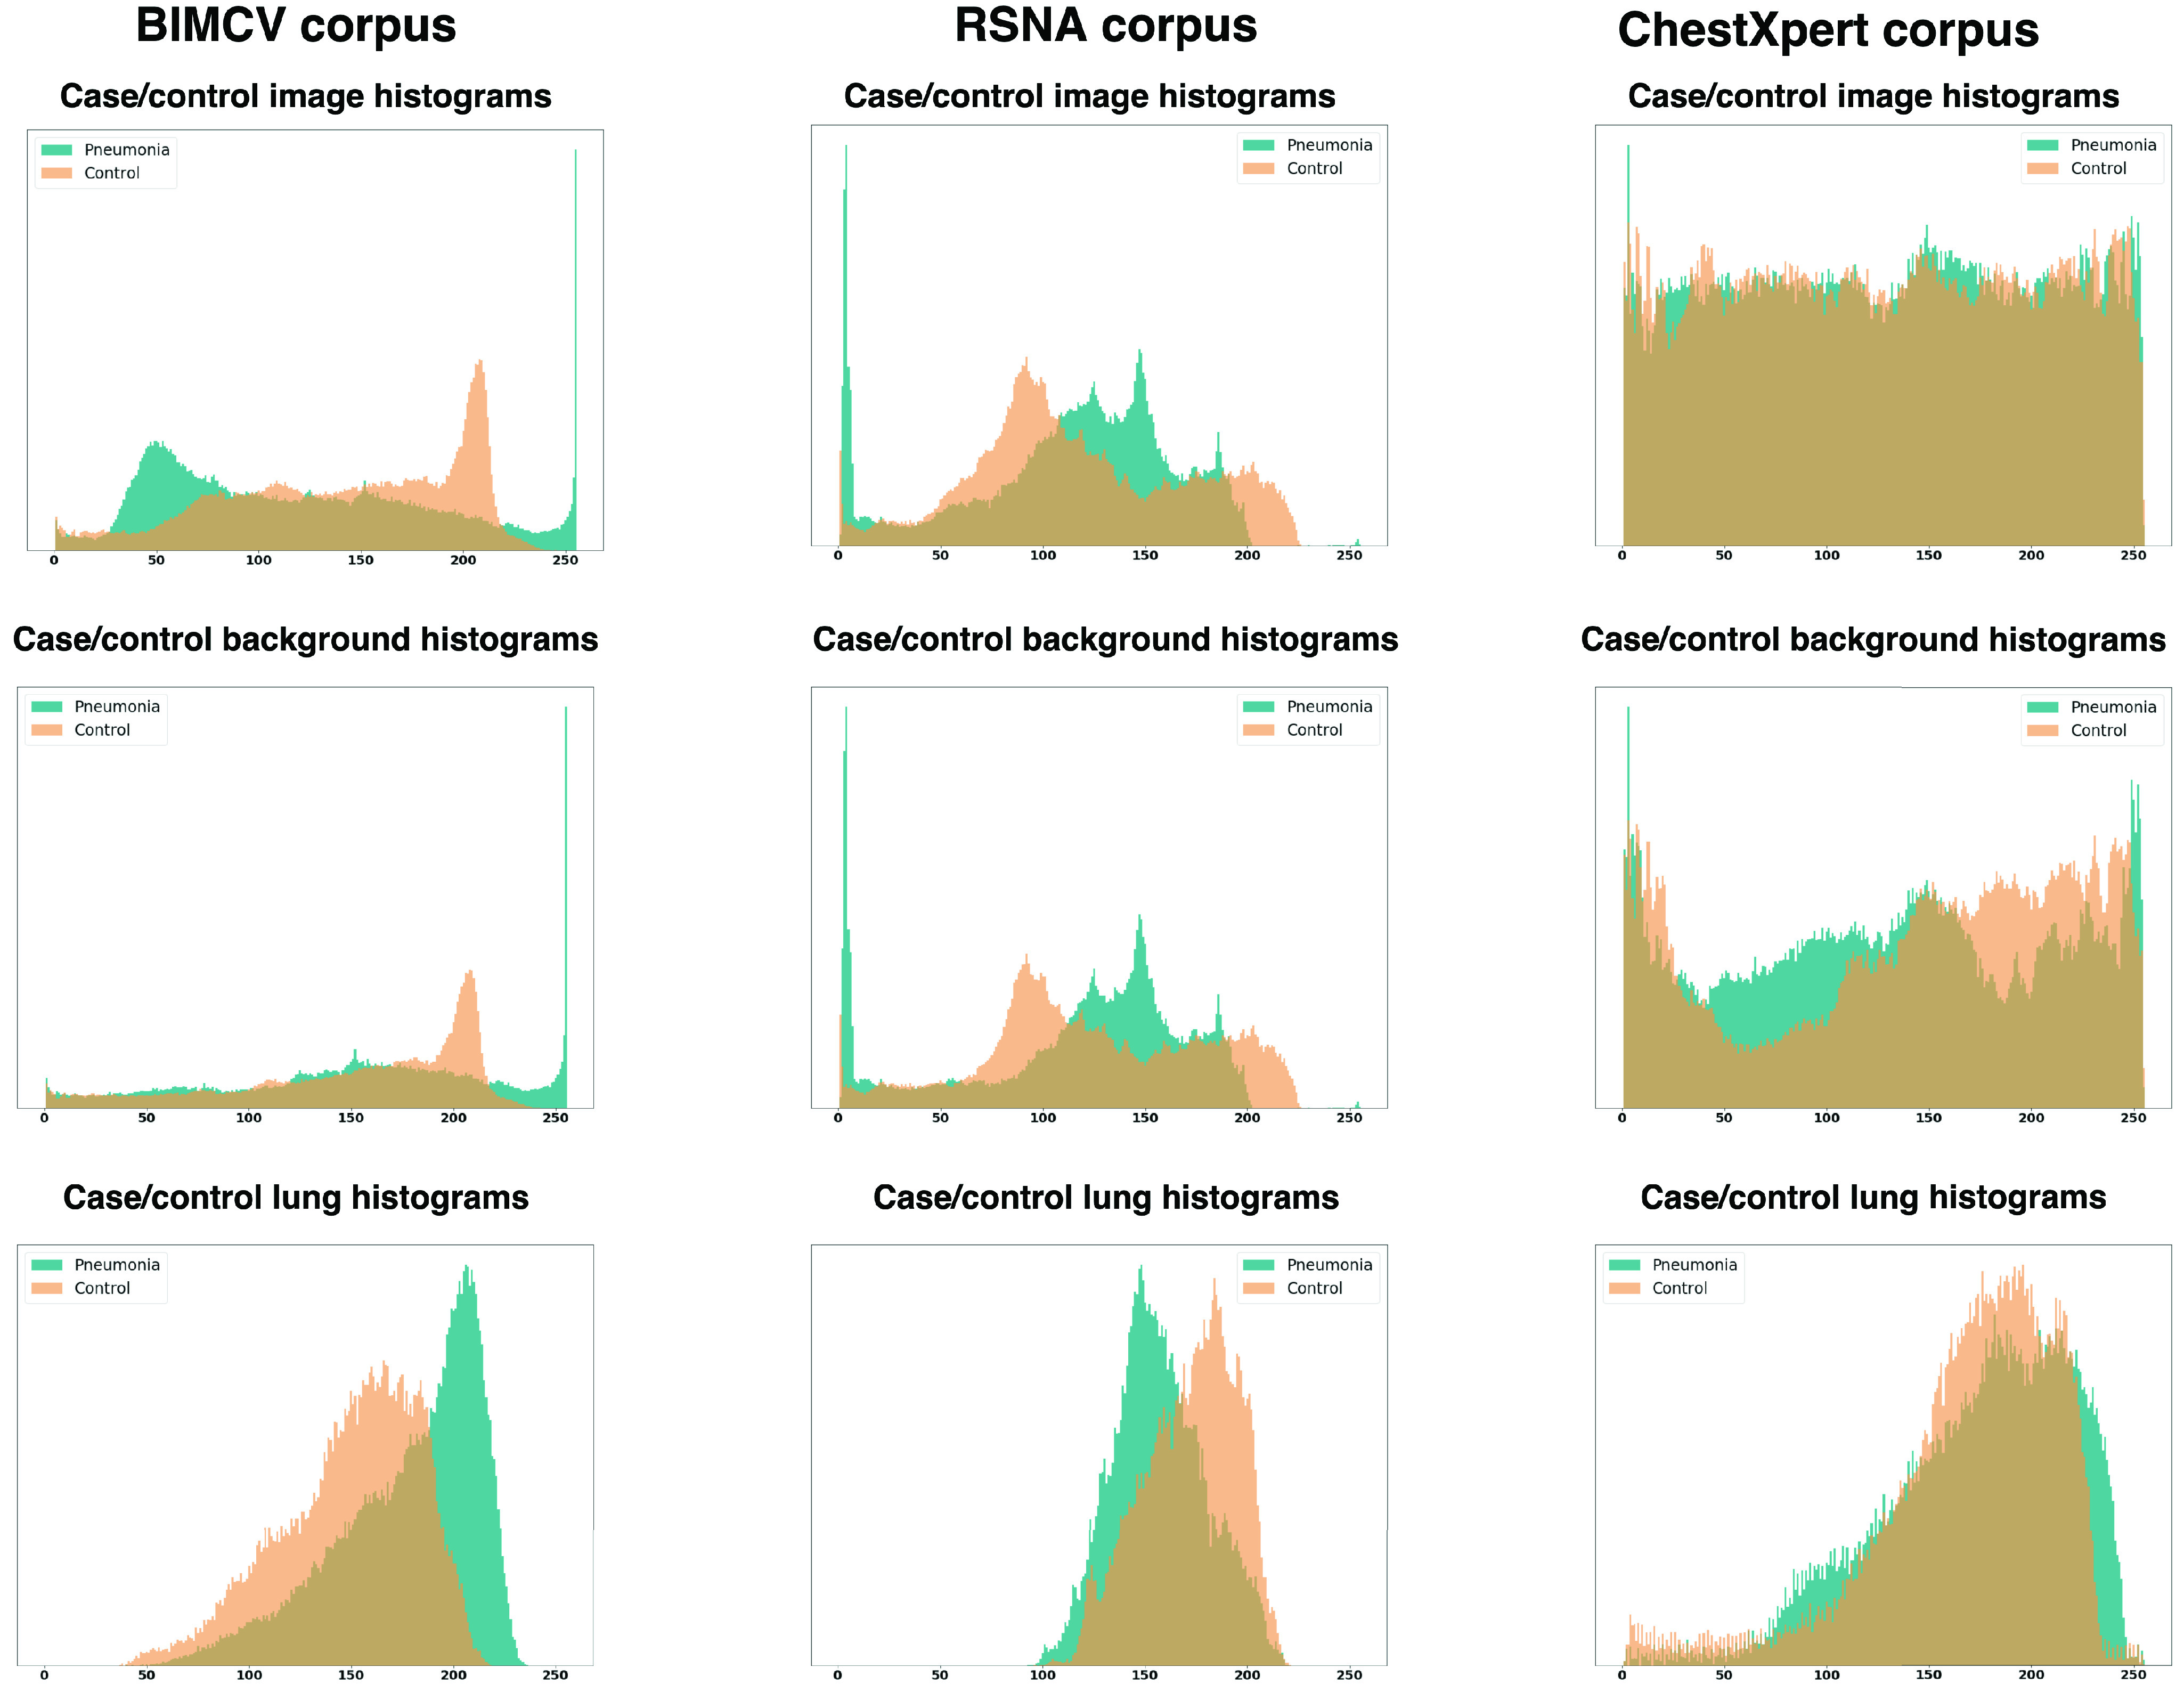
FIGURE 4.

Example of case and control patient histograms. The first row shows the histogram of the whole image for an example of a case and a control patient, the second row shows the histogram of the background (the image with the lung area subtracted) and, the last one shows the histogram of the lungs.
