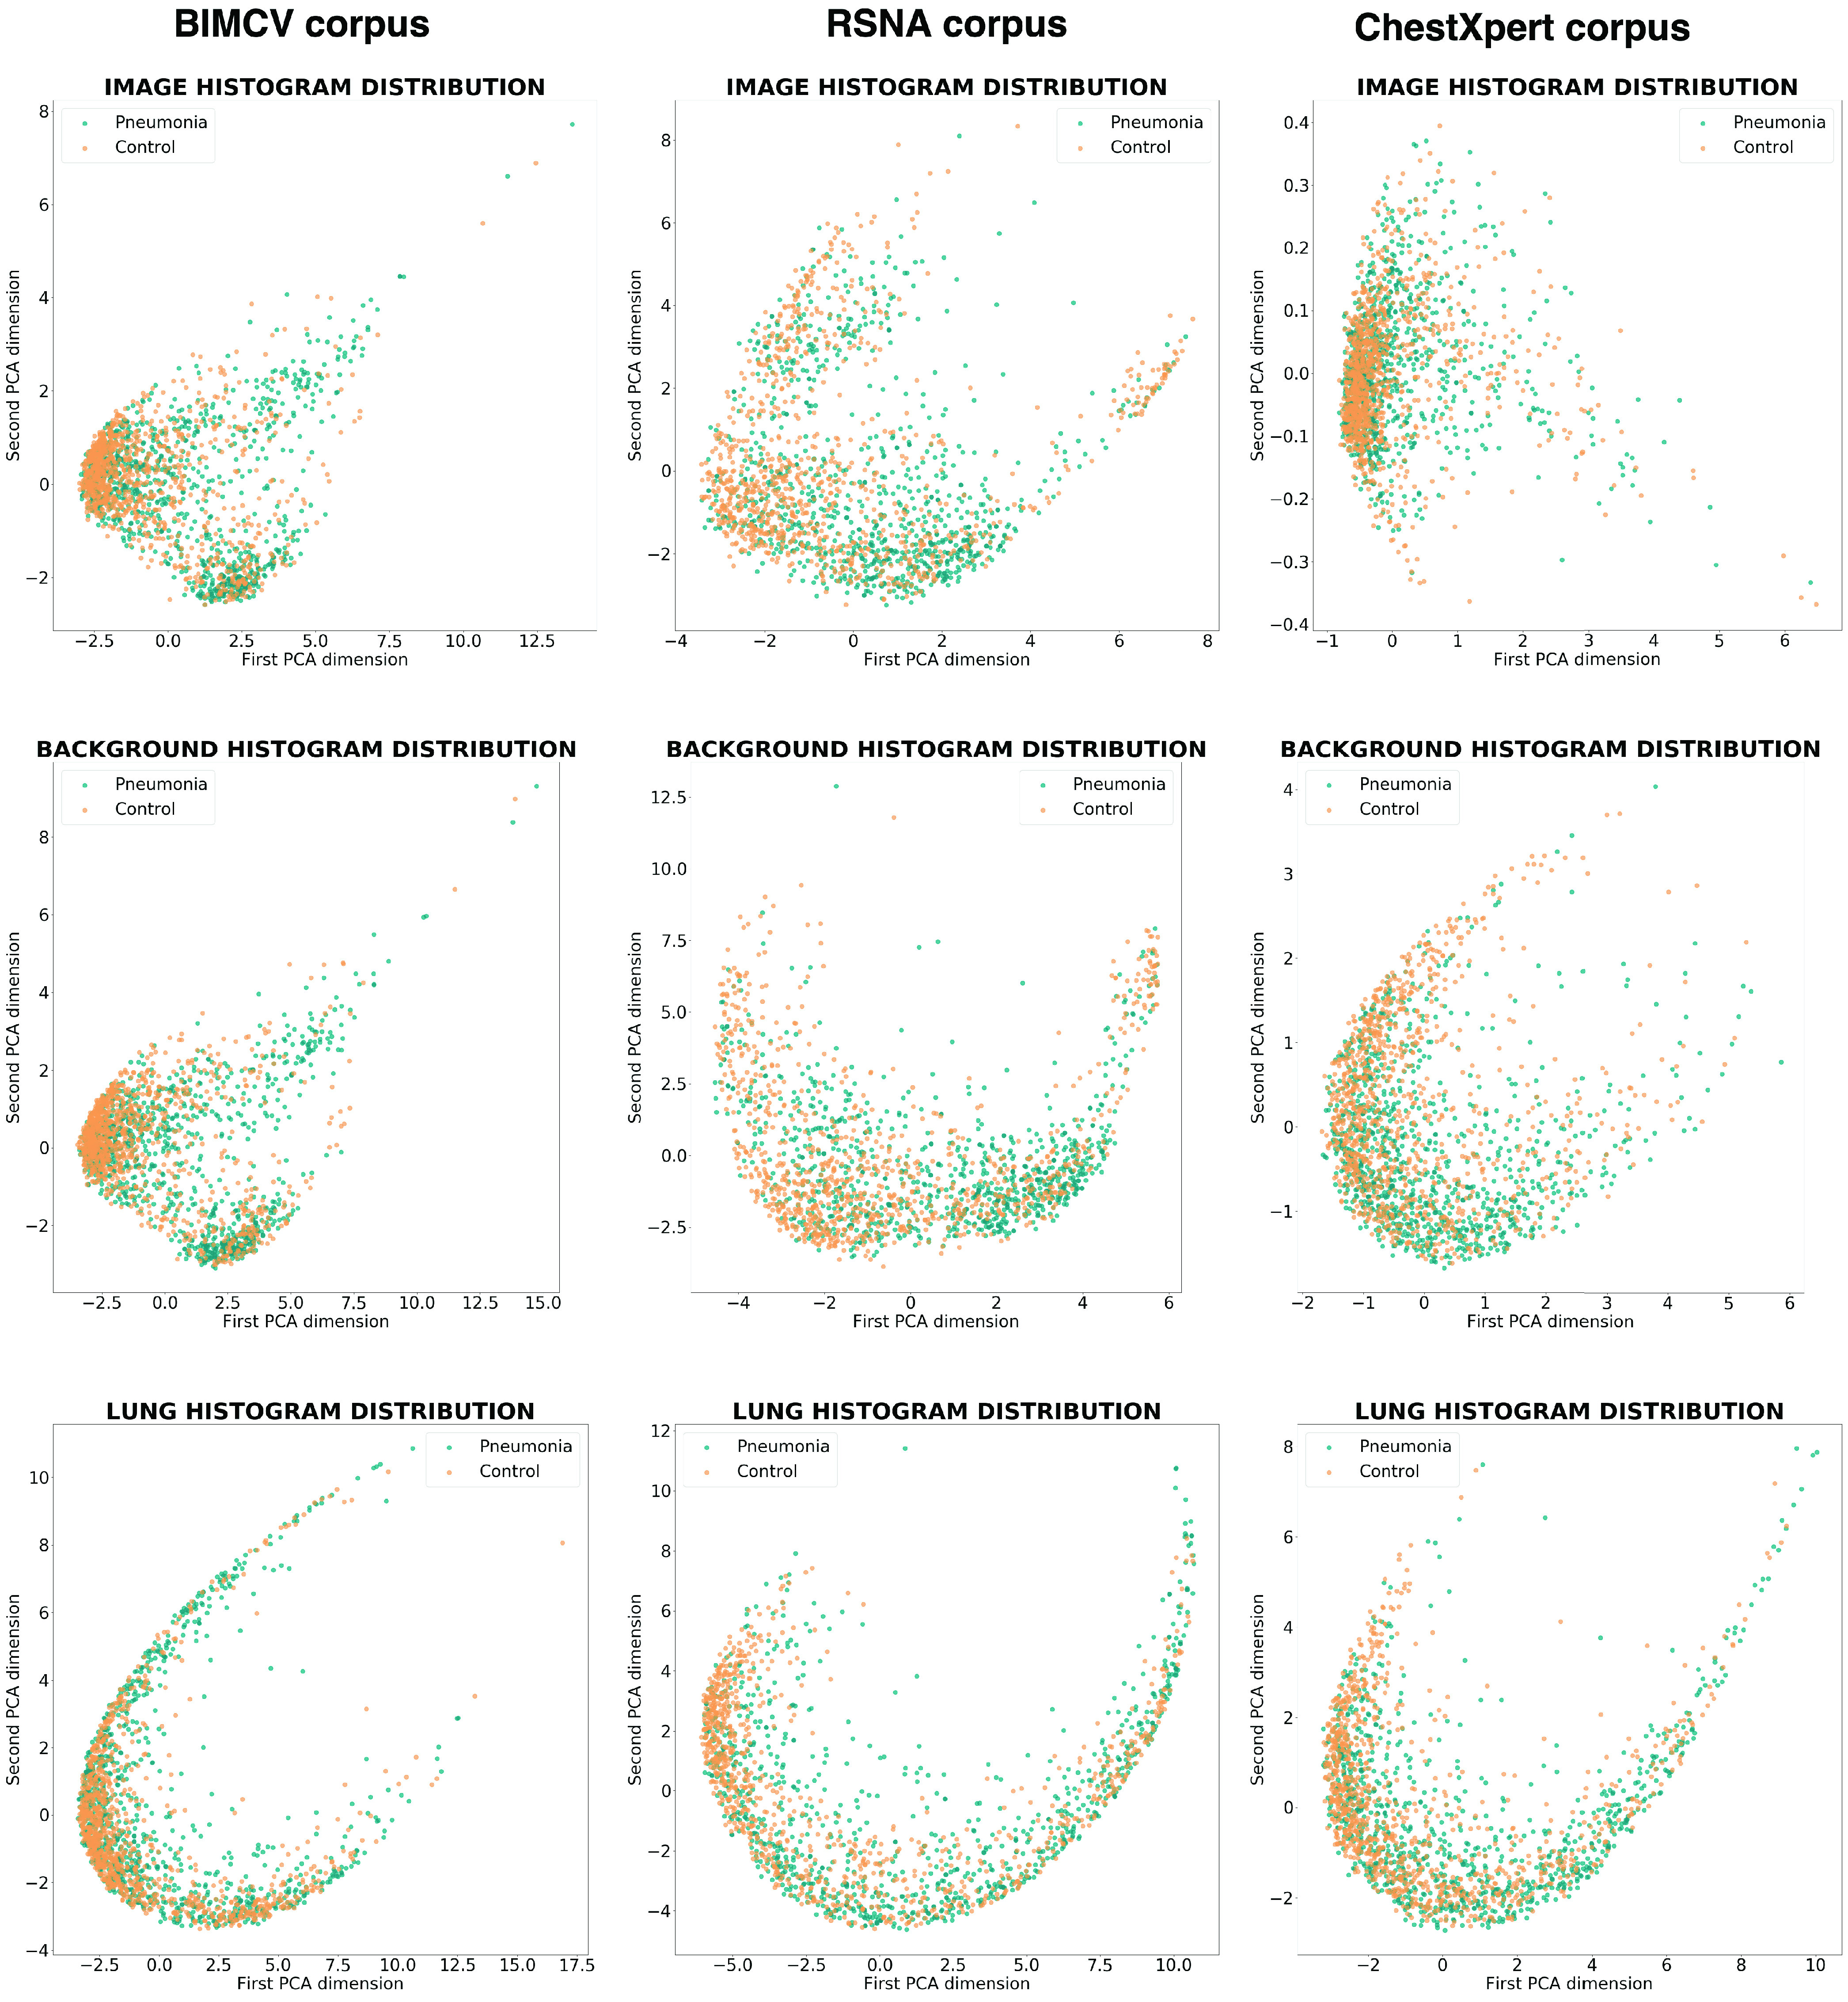
FIGURE 5.

Image histogram variability. The first row represents the variability of the histograms of the complete images, the second row the variability of the background histograms (the images with the lung area subtracted), and the third row the histograms of the lungs. The first column represents a sample of BIMCV’s dataset, the second column a sample of RSNA’s, and the last, a sample of CheXpert’s.
