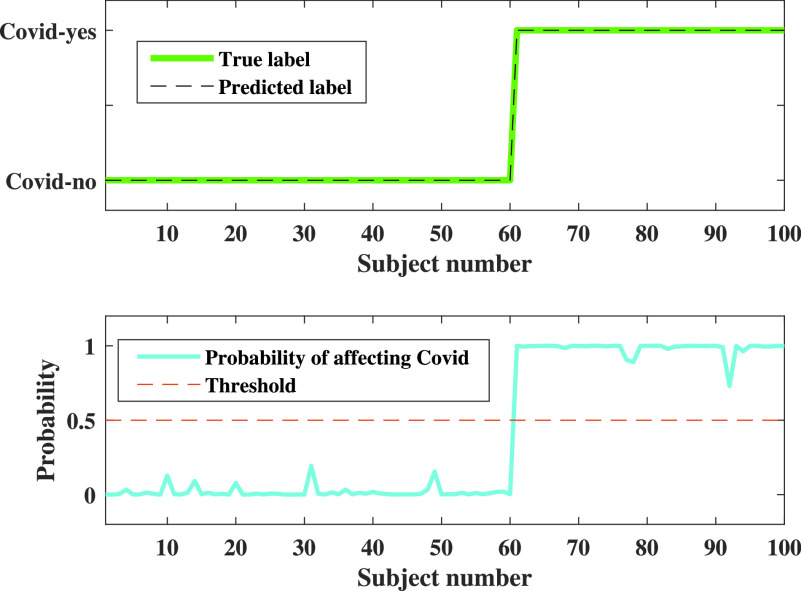
FIGURE 16.
Probabilistic output for the DSS. In the upper figure, the 0 has represented a subject with COVID negative, whereas 1 represented a subject with COVID positive. The lower figure represents a probabilistic outcome of the subject affected by COVID, where the red dotted line defines the threshold level. When the patient data level exceeds this threshold level, then the subject will be considered as COVID positive. Whereas the subject with the probability of less than 0.5, i.e., the threshold value, will be regarded as COVID negative. In either way, we can say that this the chance that a person is affected by COVID.

