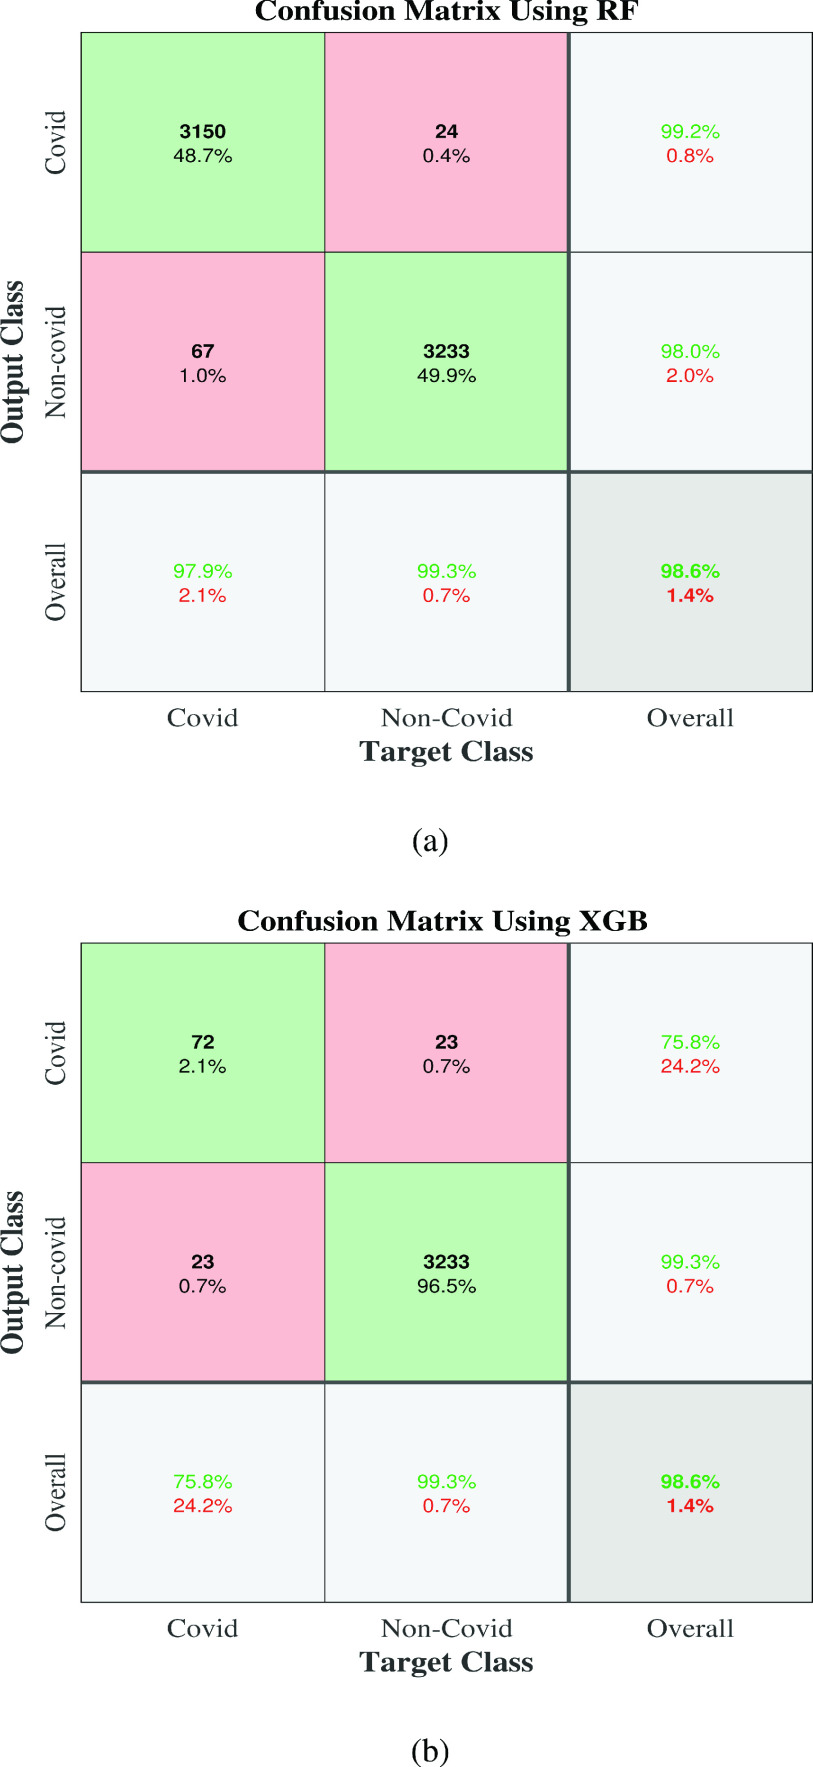
FIGURE 7.
Confusion matrix of the balanced model applied in (a) COVID test Dataset with ADASYN, (b) original COVID test Dataset only. Figure 7(a) depicts the percentage of the correct classification in with the first two diagonal cells generated by the trained network. The numbers of patients who are correctly classified as a COVID and non-COVID were 3150 and 3233, corresponding to 48.7% and 49.9% in each group’s patients, respectively. Likewise, the numbers of patients who are incorrectly classified as a COVID and non-COVID were 24 and 67, with 0.4% and 1.0% correspondingly among all patients in each group. Similarly, the overall 99.2% were correctly, and 0.8% were incorrectly classified COVID, and non-COVID were overall, 98.0% and 2.0% correctly and incorrectly classified accordingly. In the case of prediction, the correct overall predictions for COVID and non-COVID were 97.9% and 99.3%, respectively. On the other hand, the incorrect results for COVID and non-COVID were 2.1% and 0.7%. Similarly, we can also interpret Figure 7(b).

