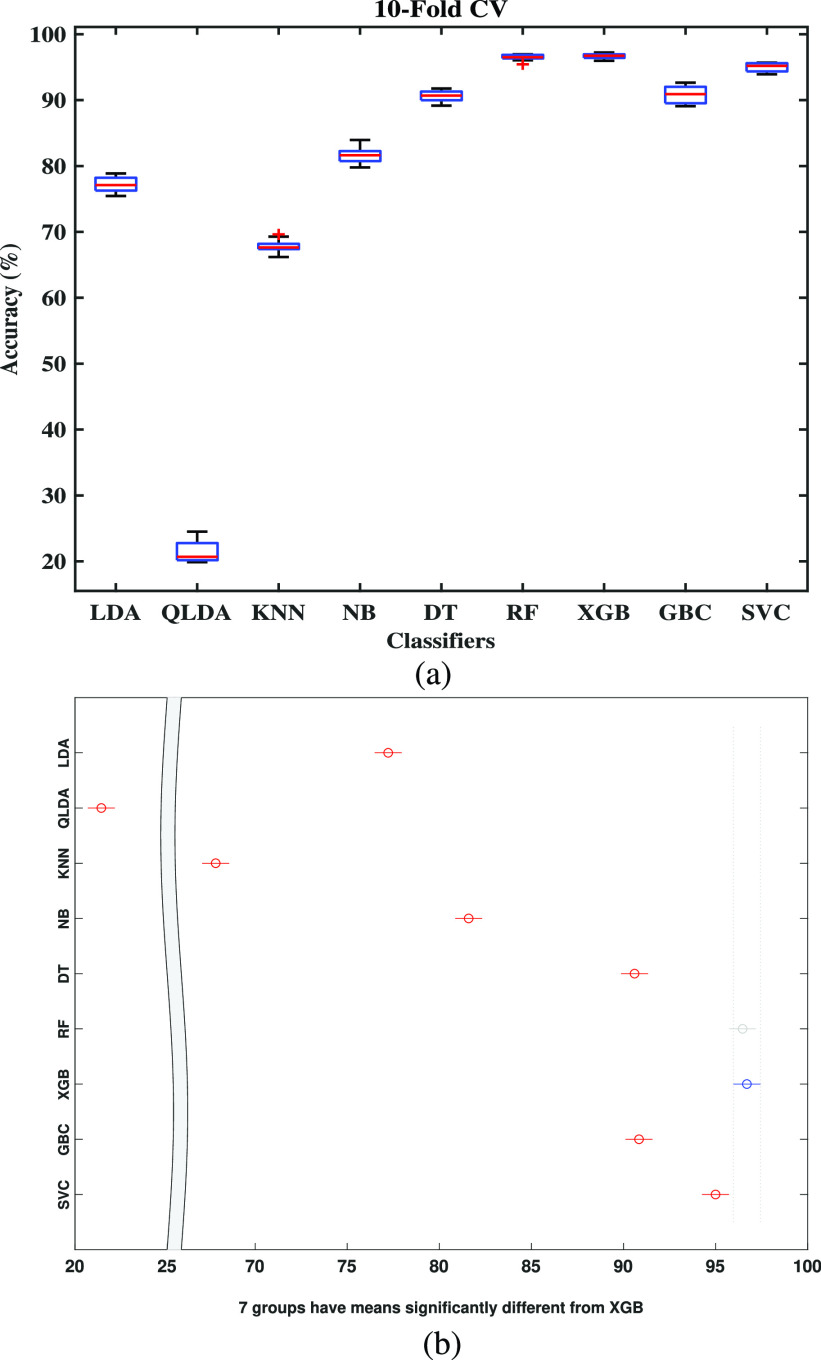
FIGURE 8.
Box-plot for (a) COVID Dataset and (b) multi-comparison test. Note that (b) is a graphical user interface tool by which one can test the statistical significance of any classifiers. Here we only show the effect of XGB. The effect of other classifiers can also be interpreted in the same way.

