10.

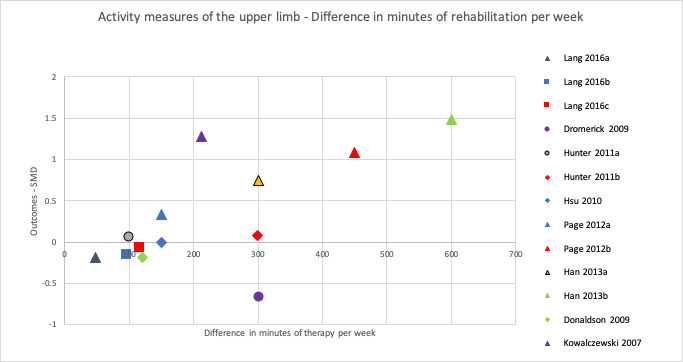
Scatter diagram plotting difference in minutes of rehabilitation per week against outcomes (SMD) for activity measures of the upper limb, immediately after intervention

Scatter diagram plotting difference in minutes of rehabilitation per week against outcomes (SMD) for activity measures of the upper limb, immediately after intervention