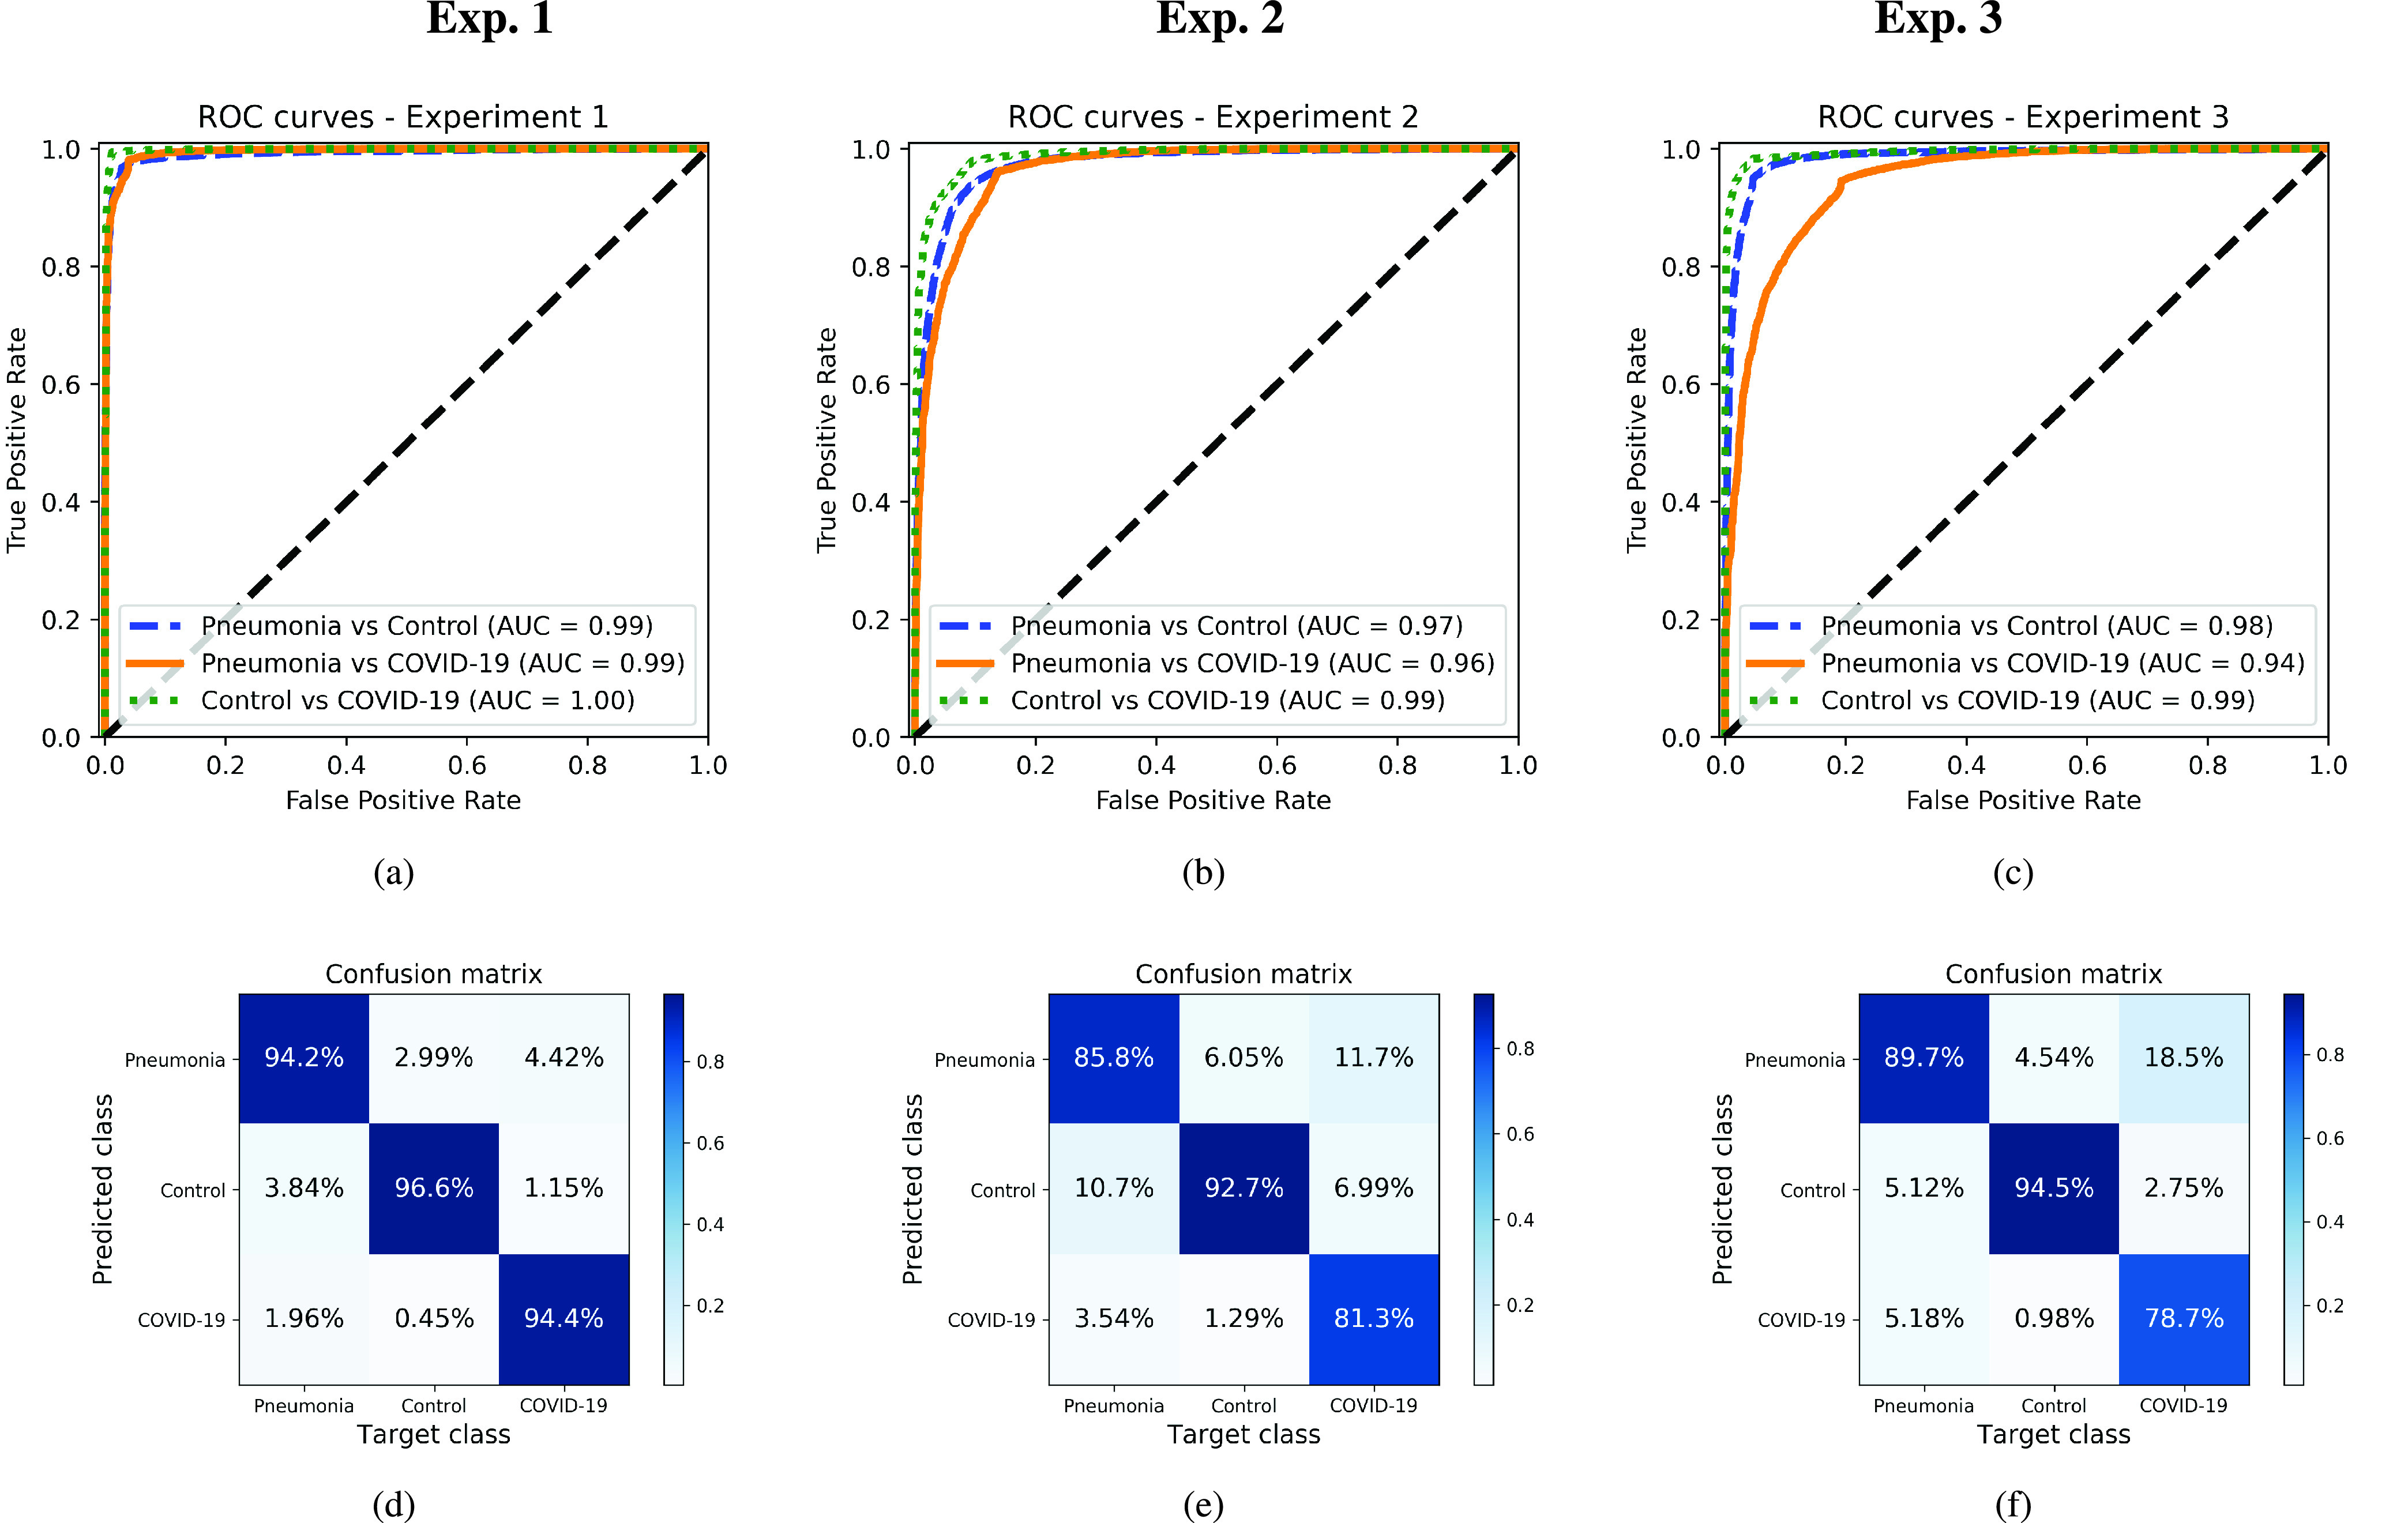
FIGURE 3.

ROC curves and confusion matrices for each one of the experiments, considering each one of the classes separately. Top: ROC curves. Bottom: Normalized confusion matrices. Left: Original images (experiment 1). Center: Cropped Images (experiment 2). Right: Segmented images (experiment 3).
