
FIGURE 5.
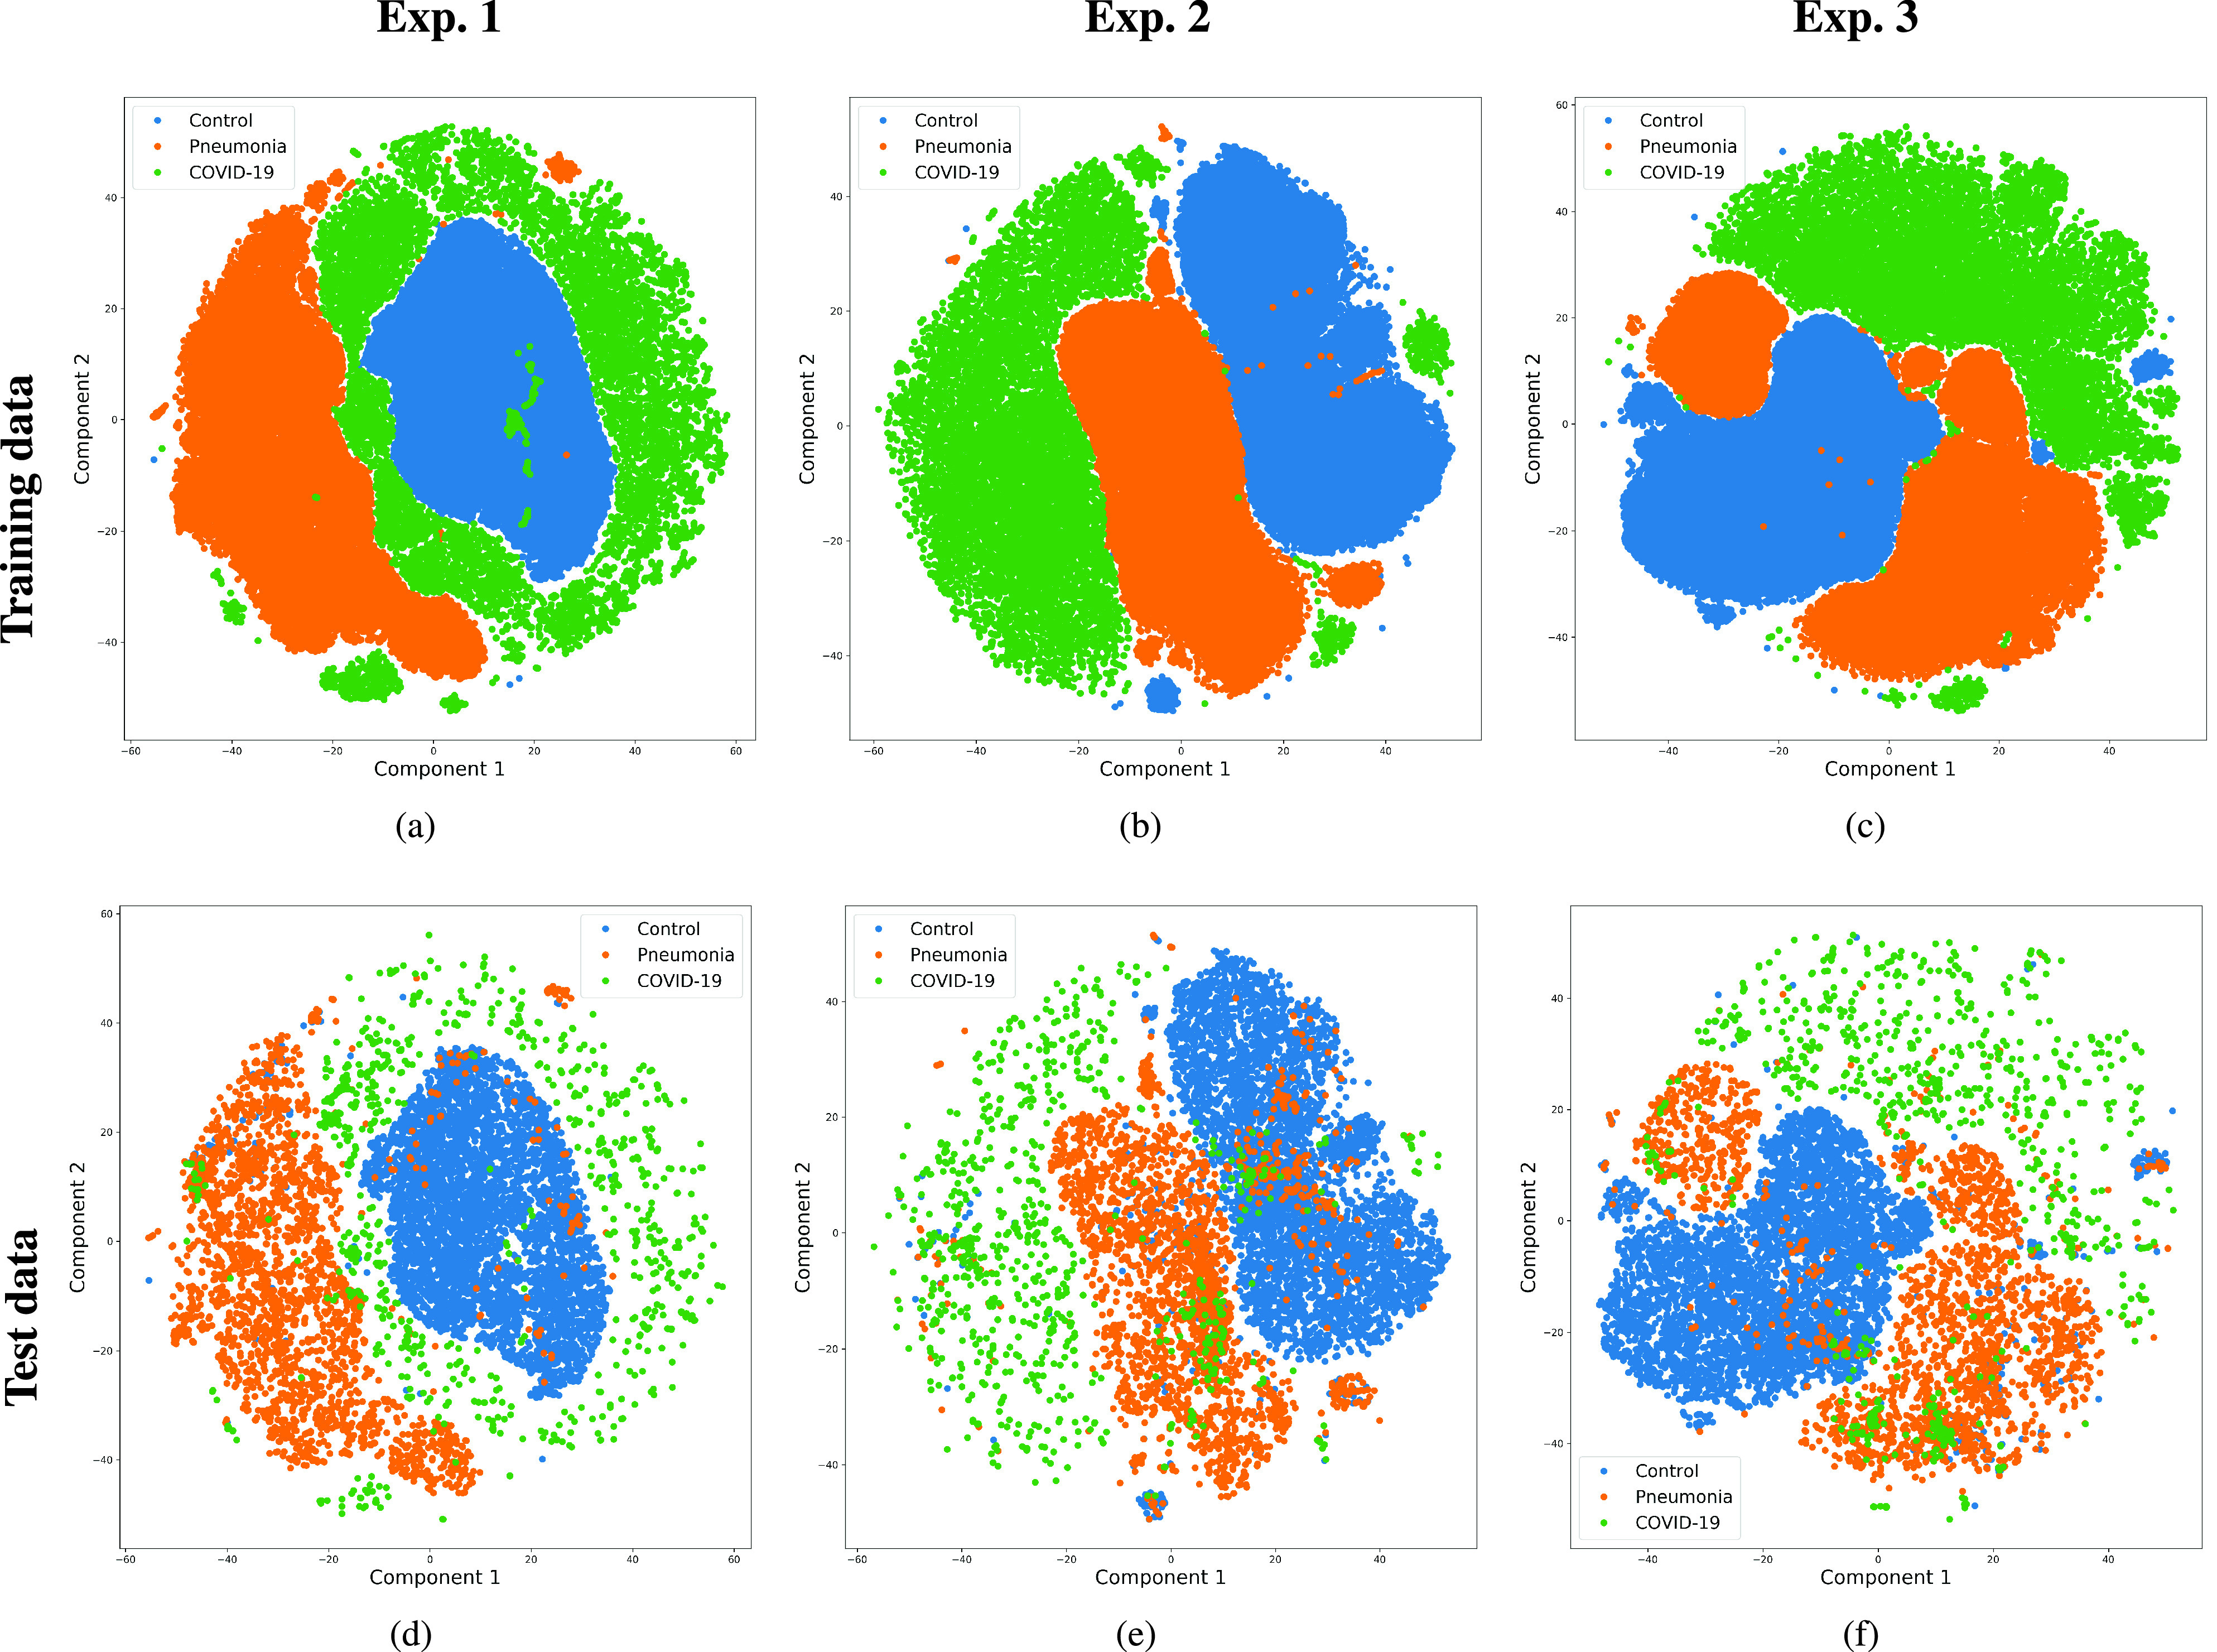
Mapping of the high-dimensional data of the layer adjacent to the output into a two dimensional plot. Top: Output network embedding using t-SNE for the training data. Bottom: Output network embedding using t-SNE for the testing data. Left: Original images (experiment 1). Center: Cropped Images (experiment 2). Right: Segmented images (experiment 3).