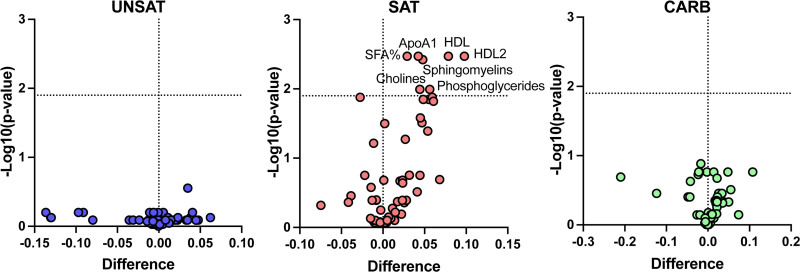
Figure 1.
Change in the nuclear magnetic spectroscopy metabolomic profile during the 3-wk overfeeding of unsaturated fat (UNSAT), saturated fat (SAT), and simple carbs (CARB). Metabolomic analysis was performed from plasma samples collected at baseline and at the end of the intervention. The log-transformed metabolite concentrations were compared using paired 2-sided Student t test with false discovery rate method described by Benjamini and Hochberg. Differences were calculated by subtracting the mean before-value from the mean after-value. Thus, a positive difference indicates an increase and a negative difference a decrease in the mean metabolite concentration or proportion. UNSAT, n=11; SAT, n=13; CARB, n=12. ApoA1 indicates apolipoprotein A1; CARB, simple carbs; HDL, high-density lipoprotein; and SFA%, percentage of saturated fatty acids.

