Figure 2.
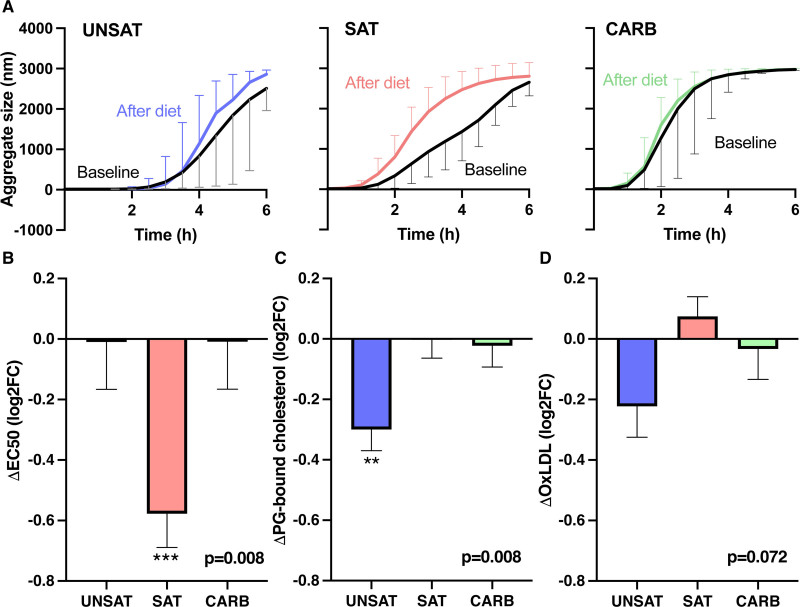
Changes in LDL (low-density lipoprotein) aggregation, lipoproteins proteoglycan-binding, and oxidized LDL (oxLDL) during the 3-wk overfeeding of unsaturated fat (UNSAT), saturated fat (SAT), and simple carbs (CARB). A, The aggregate sizes (median±interquartile range) at the various time points are shown in the UNSAT, SAT, and CARB groups. LDL was isolated from plasma samples collected at the baseline and at the end of the diet. LDL aggregation was induced by addition of human recombinant sphingomyelinase, and the increase in LDL aggregate size was followed by dynamic light scattering. Inflection point of the aggregate size vs time curves was used as a measure of LDL aggregation susceptibility. B, Change in LDL aggregation susceptibility. C, Change in the proteoglycan-binding of plasma lipoproteins. Aliquots of plasma samples collected at the baseline and at the end of the study were incubated in microtiter wells coated with human aortic proteoglycans and the amount of cholesterol bound was measured after incubation for 1 h. D, Change in the concentration of oxLDL. ELISA was used to measure oxLDL concentrations in plasma samples collected at the baseline and at the end of the intervention. The changes in B–D are presented as mean±SE of mean of the log2 values of fold changes. A positive value indicates an increase and a negative value a decrease in the value. Two-way ANOVA with repeated measures was used to test differences between groups during interventions. P values (at the bottom) are reported for the effect of interaction term (time×group). Asterisks represent P value for within-group changes calculated by Šidak post hoc test. The data were analyzed using GraphPad Prism version 8.0.1. **P<0.01; ***P<0.001.

