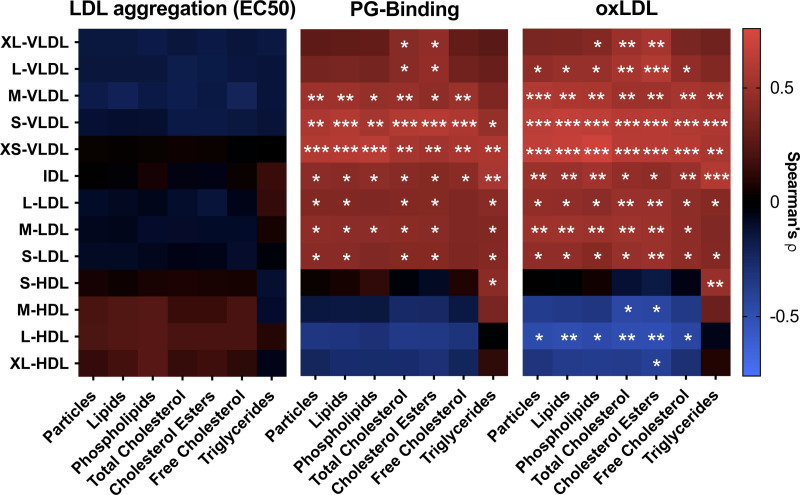
Figure 4.
Relationships between LDL (low-density lipoprotein) aggregation susceptibility, proteoglycan-binding of plasma lipoproteins, and plasma oxidized LDL (oxLDL) concentrations, and plasma lipoprotein subclasses at baseline. A, LDL aggregation, (B) the binding of plasma lipoproteins to proteoglycans, and (C) concentrations of oxLDL in plasma were determined as described under Figure 3 and Methods. Quantitative nuclear magnetic spectroscopy metabolomics was used for the quantification of plasma lipoprotein subclasses and their components. The associations for log-transformed metabolite concentrations were analyzed using Spearman correlation coefficient analysis. In heatmaps, the positive correlations are represented with red and negative correlations with blue. Unsaturated fat, n=11; saturated fat, n=13; simple carbs, n=12. *P<0.05, **P<0.01, ***P<0.001.

