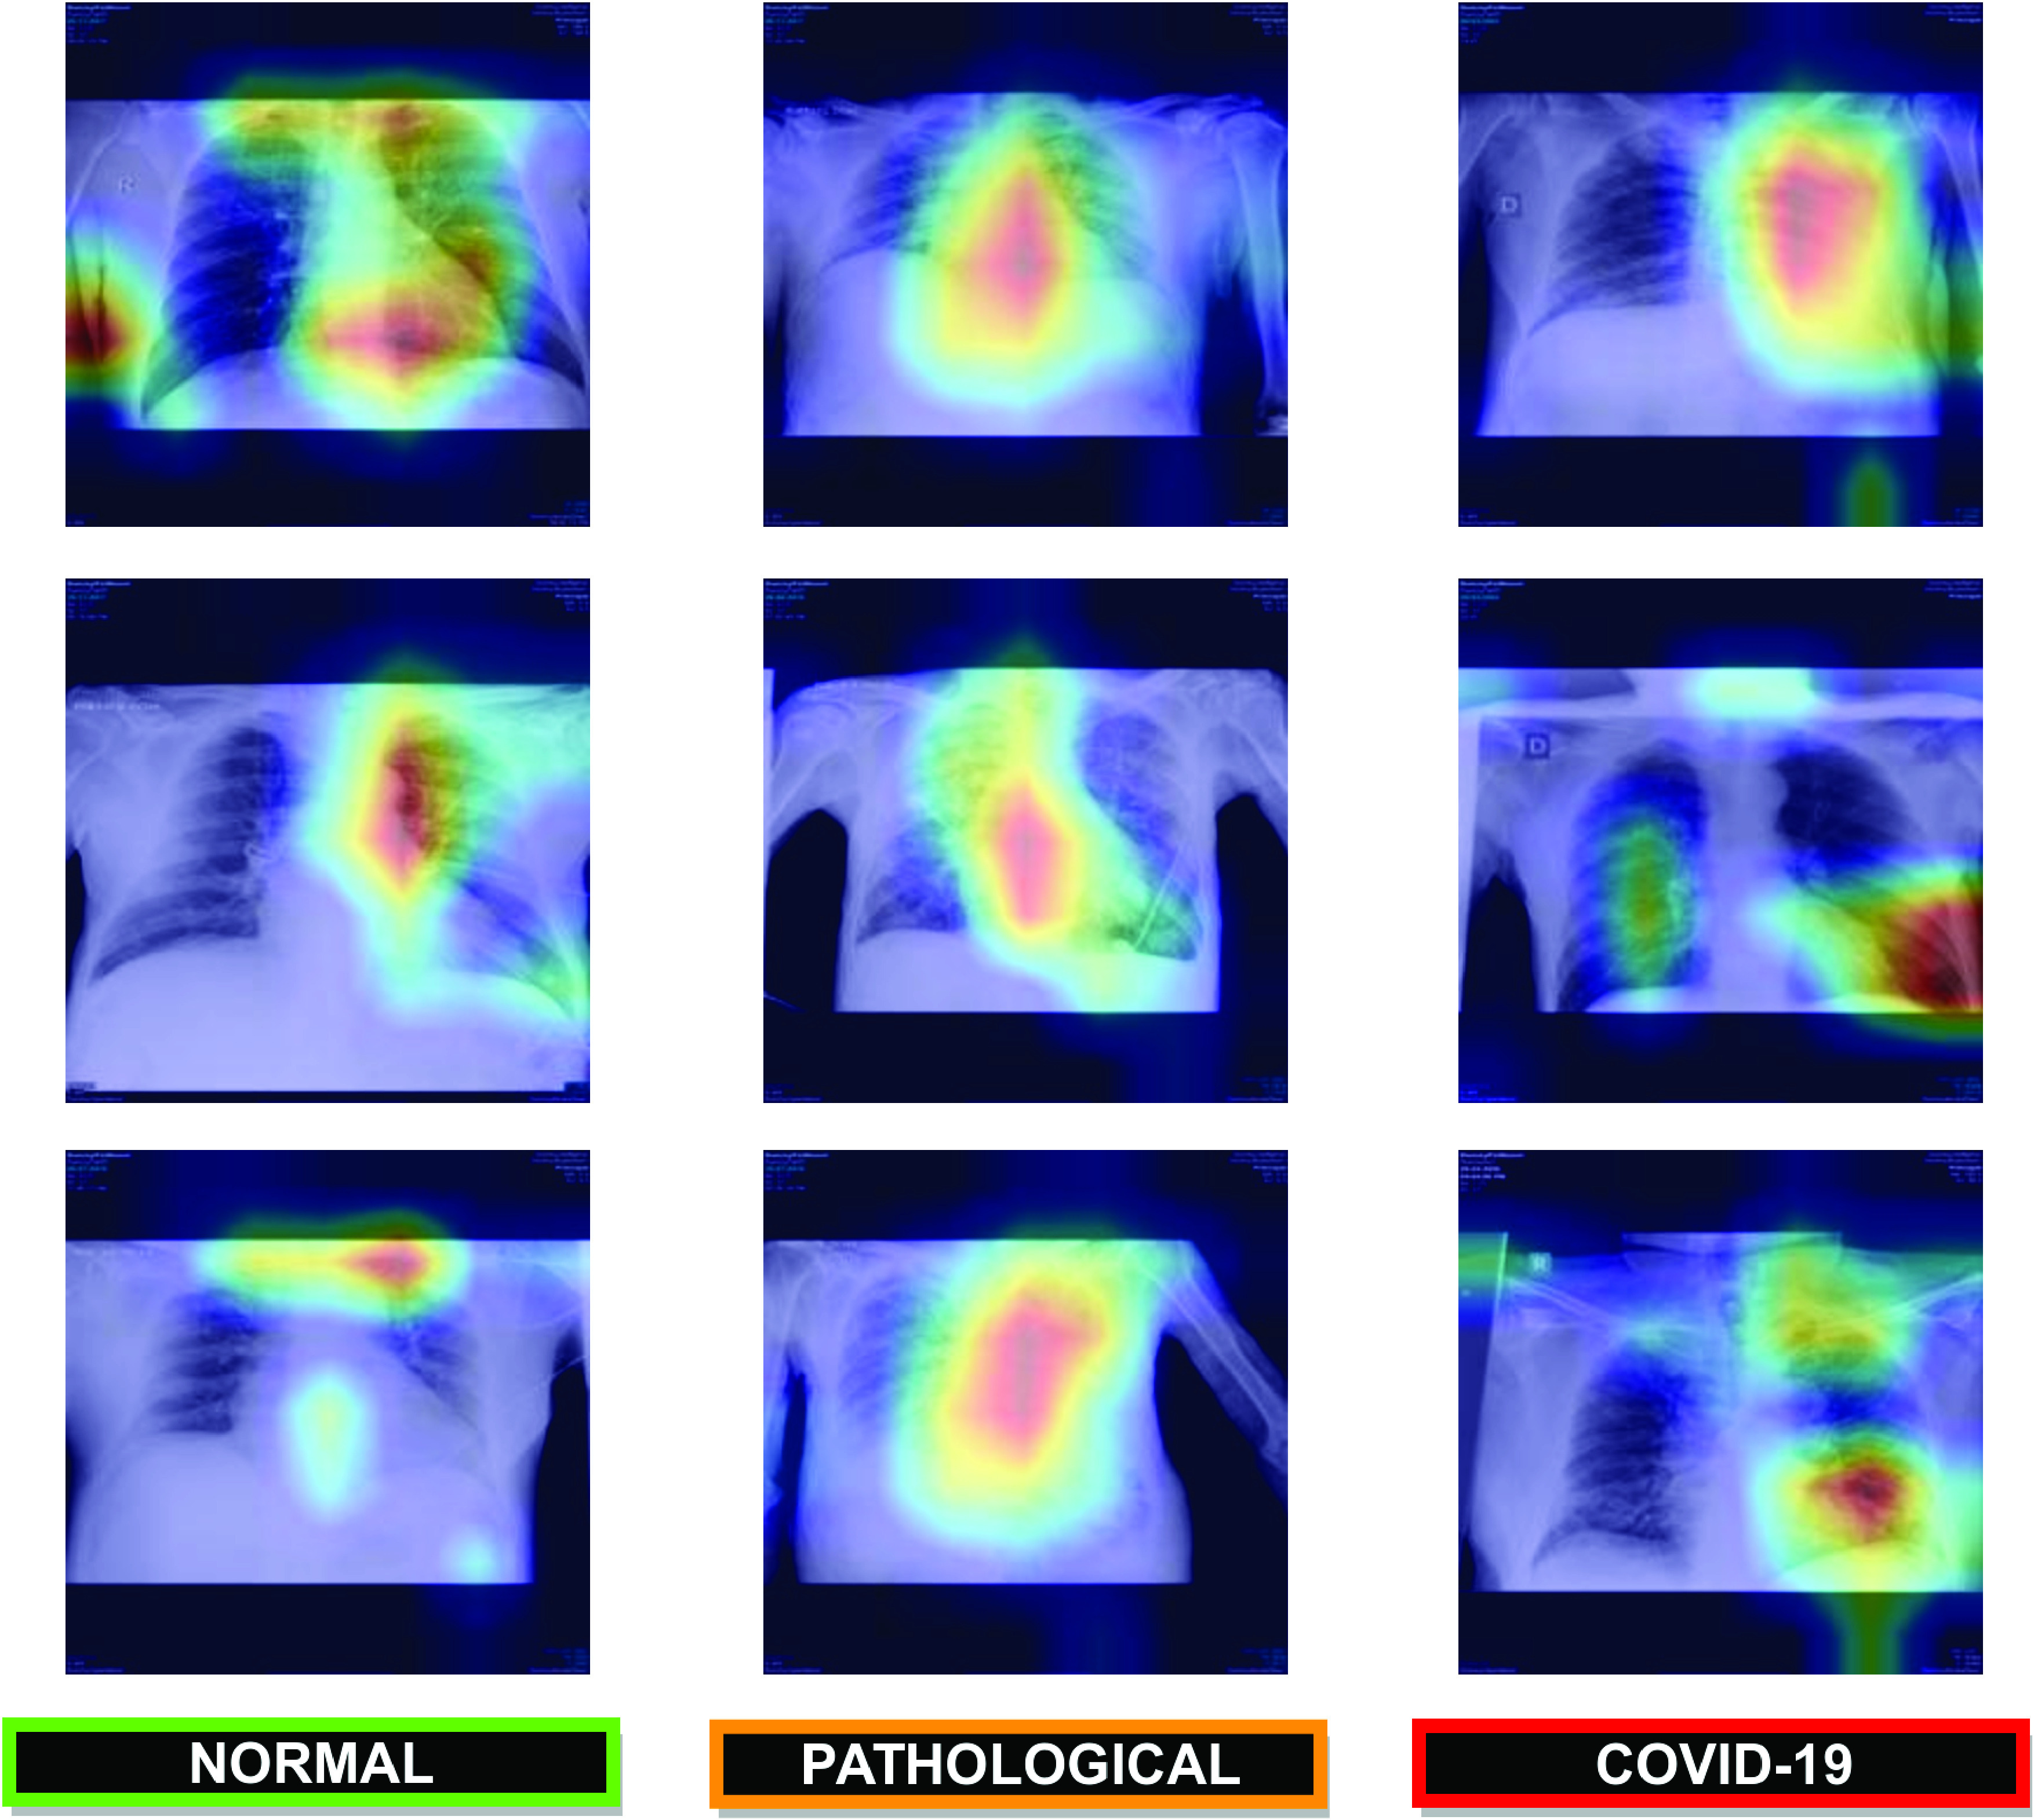
FIGURE 12.

Representative examples of the generated gradient class activation maps based on predictions that illustrate parts of the chest X-ray image that are strongly activated.  row, using the Normal vs Pathological/COVID-19 approach.
  row, using the Normal/Pathological vs COVID-19 approach.
  row, using the Normal vs Pathological vs COVID-19 approach.
