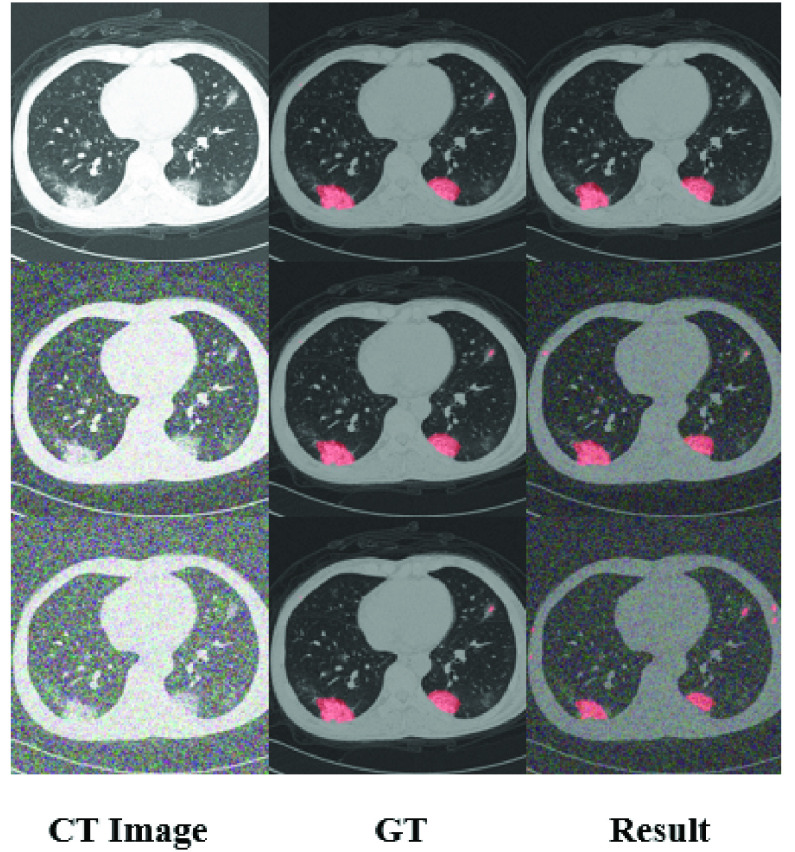
FIGURE 6.
Results with different noise. The first column is the input CT images. The second column is the ground truth, and the third column is the segmentation results. The first row is the original input, the second row is the input which is infected by gaussian noise with a variance of 0.05. The third row is infected with a variance of 0.10.

