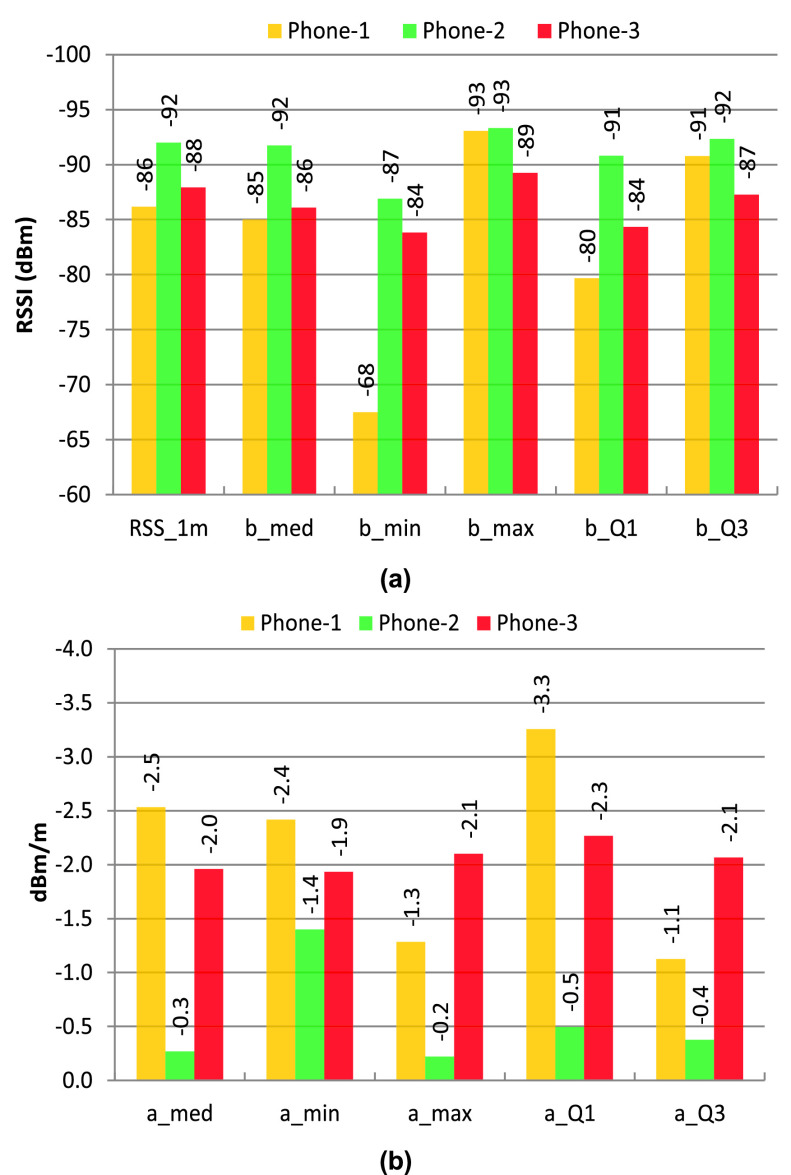
FIGURE 7.
(a) Phone specific RSSI values for the 1 m reference and the RSSI threshold of  for different levels of RSSI data (maximum, minimum, median, Q1 of 75%, and Q3 of 75% RSSI values), (b) phone specific values of a for different levels of RSSI data (maximum, minimum, median, Q1 of 75%, and Q3 of 75%.

