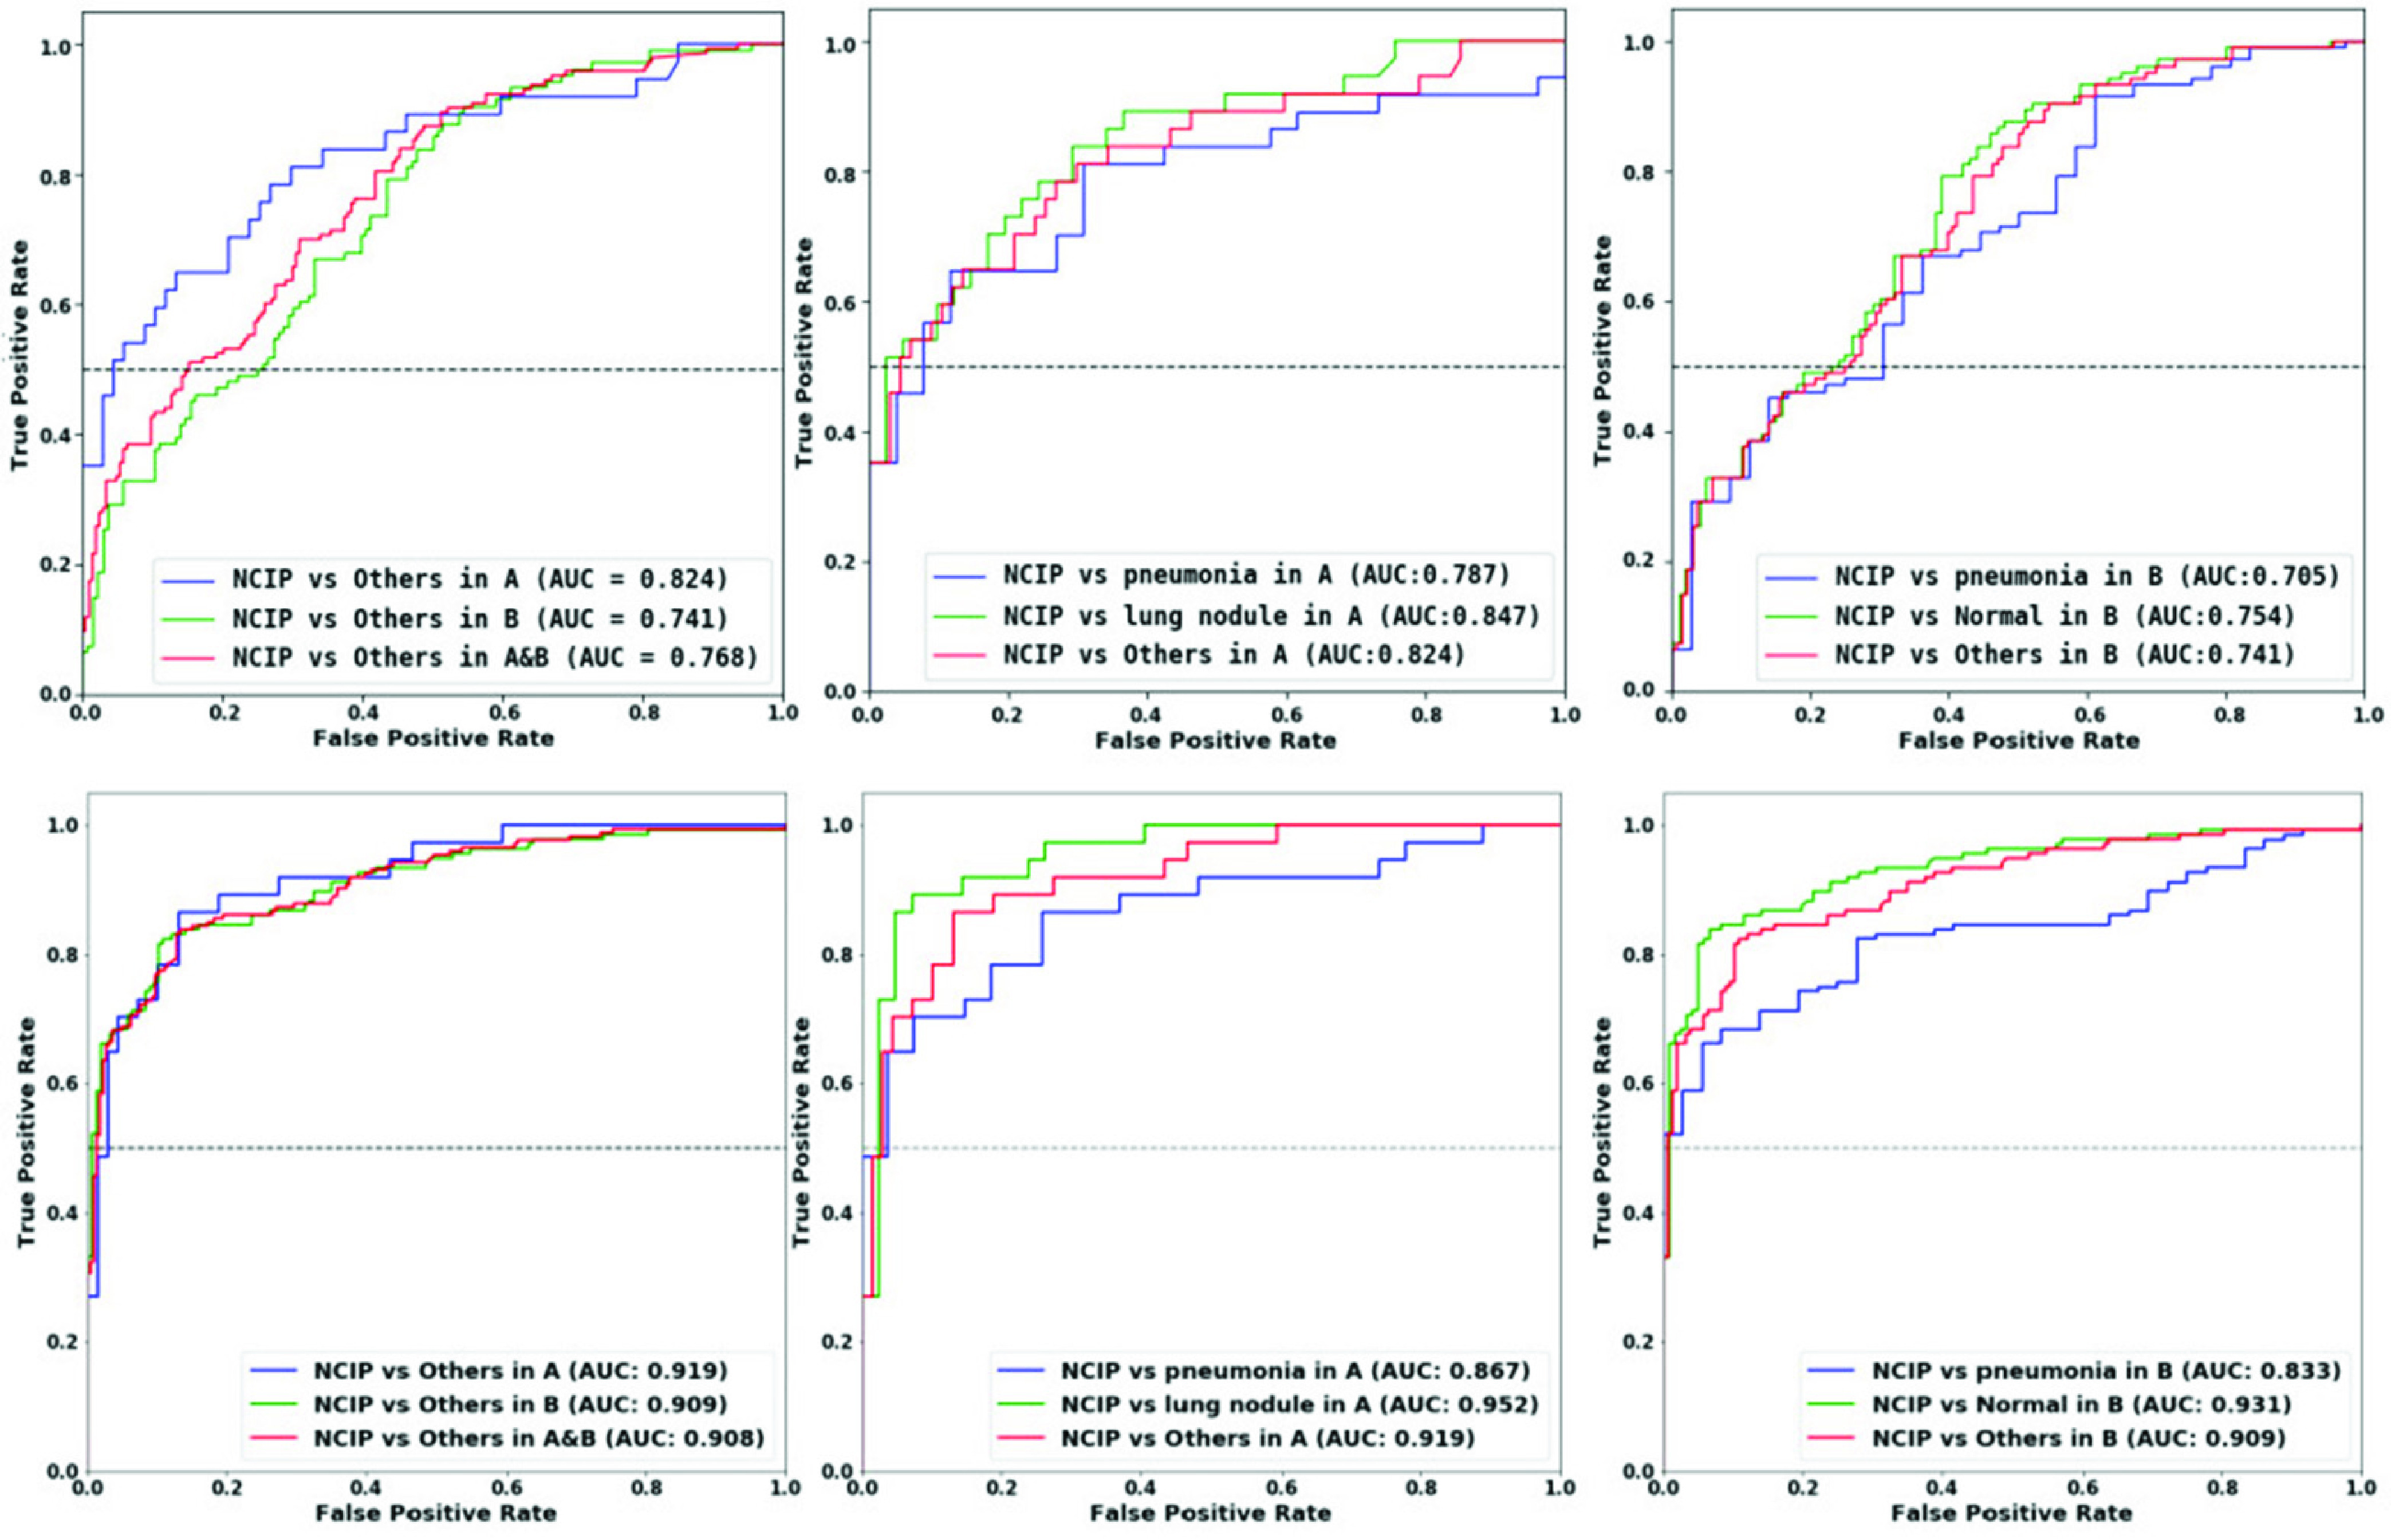
FIGURE 5.

The receiver operating characteristic (ROC) curves for the case-based performances of COVID-19 DIAGNOSIS. The first row is the Mask-R-CNN-SVM ROC CURVES. The second row is the NCIP-Net ROC curve. Left: Three ROC Curves show the test result with 106 cases (37 OF NCIPS, 27 of other pneumonia, and 42 of lung nodules), the external validation result with 293 cases (136 NCIP cases, 36 other pneumonia cases, and 121 normal cases) from hospital B, and the superset including validation and test sets. Middle: Three ROC curves show the validation results including NCIPS vs Other two patient groups. Right: Three ROC curves show the testing results including ncips vs other two patient groups.
