
FIGURE 6.
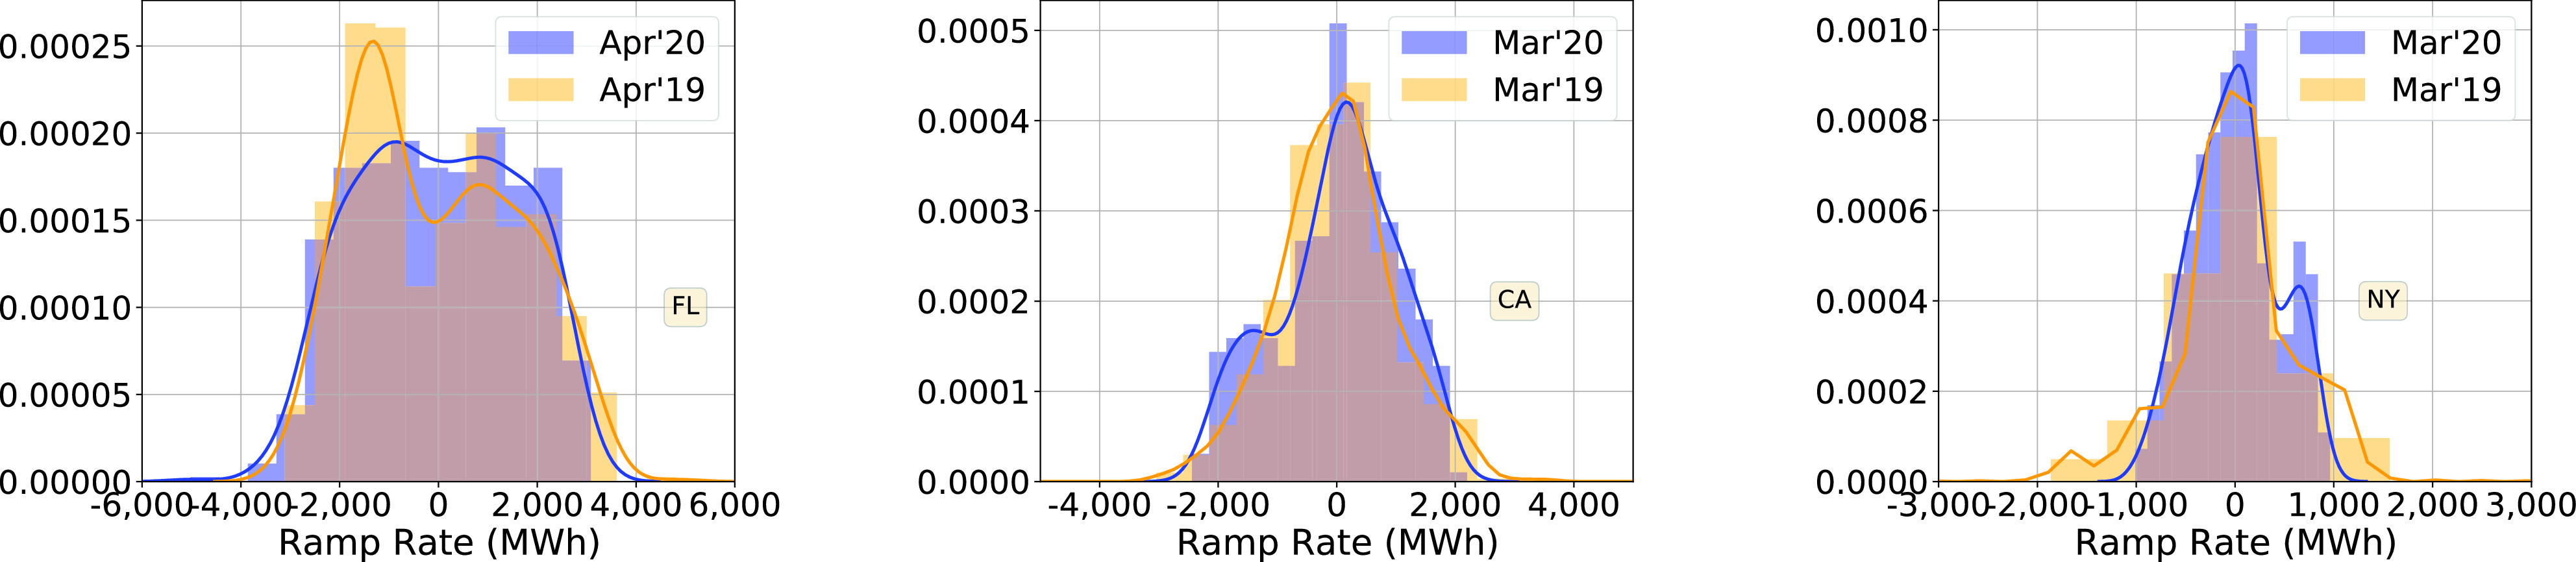
Probability densities of hourly demand ramp rate, with 4 weeks of data after the stay-home order in 2020, and the corresponding period in 2019.
Official websites use .gov
A
.gov website belongs to an official
government organization in the United States.
Secure .gov websites use HTTPS
A lock (
) or https:// means you've safely
connected to the .gov website. Share sensitive
information only on official, secure websites.
Probability densities of hourly demand ramp rate, with 4 weeks of data after the stay-home order in 2020, and the corresponding period in 2019.