
FIGURE 9.
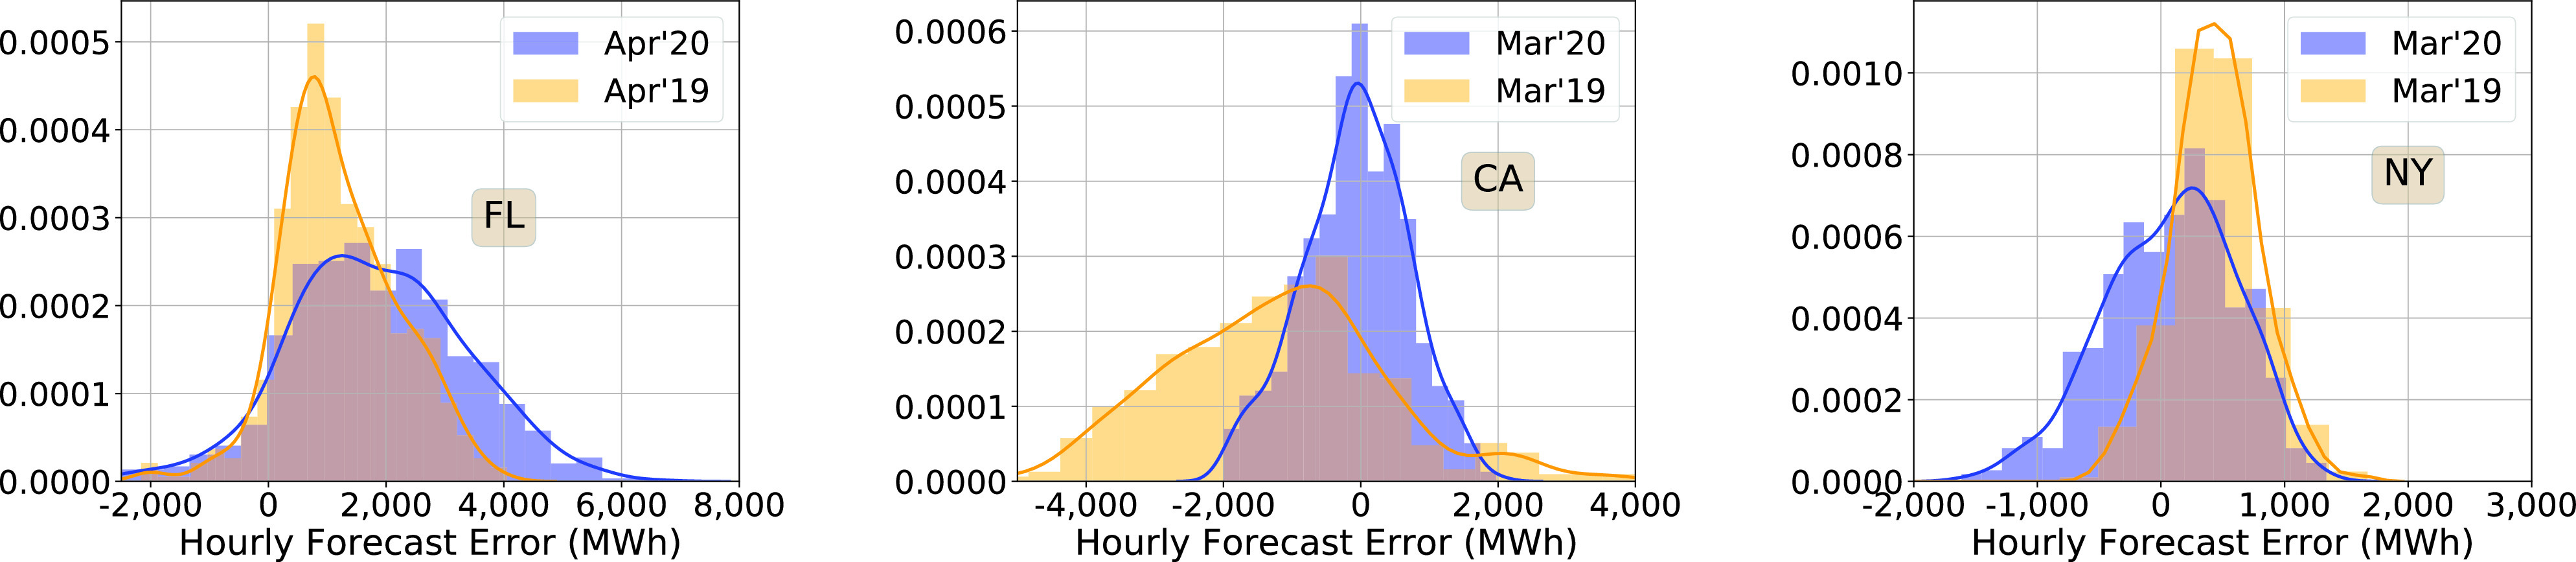
Hourly demand forecast error probability densities, with data from a four week period starting on the day stay-at-home order was issued. The 2019 data was for the corresponding period.
Official websites use .gov
A
.gov website belongs to an official
government organization in the United States.
Secure .gov websites use HTTPS
A lock (
) or https:// means you've safely
connected to the .gov website. Share sensitive
information only on official, secure websites.
Hourly demand forecast error probability densities, with data from a four week period starting on the day stay-at-home order was issued. The 2019 data was for the corresponding period.