
FIGURE 1.
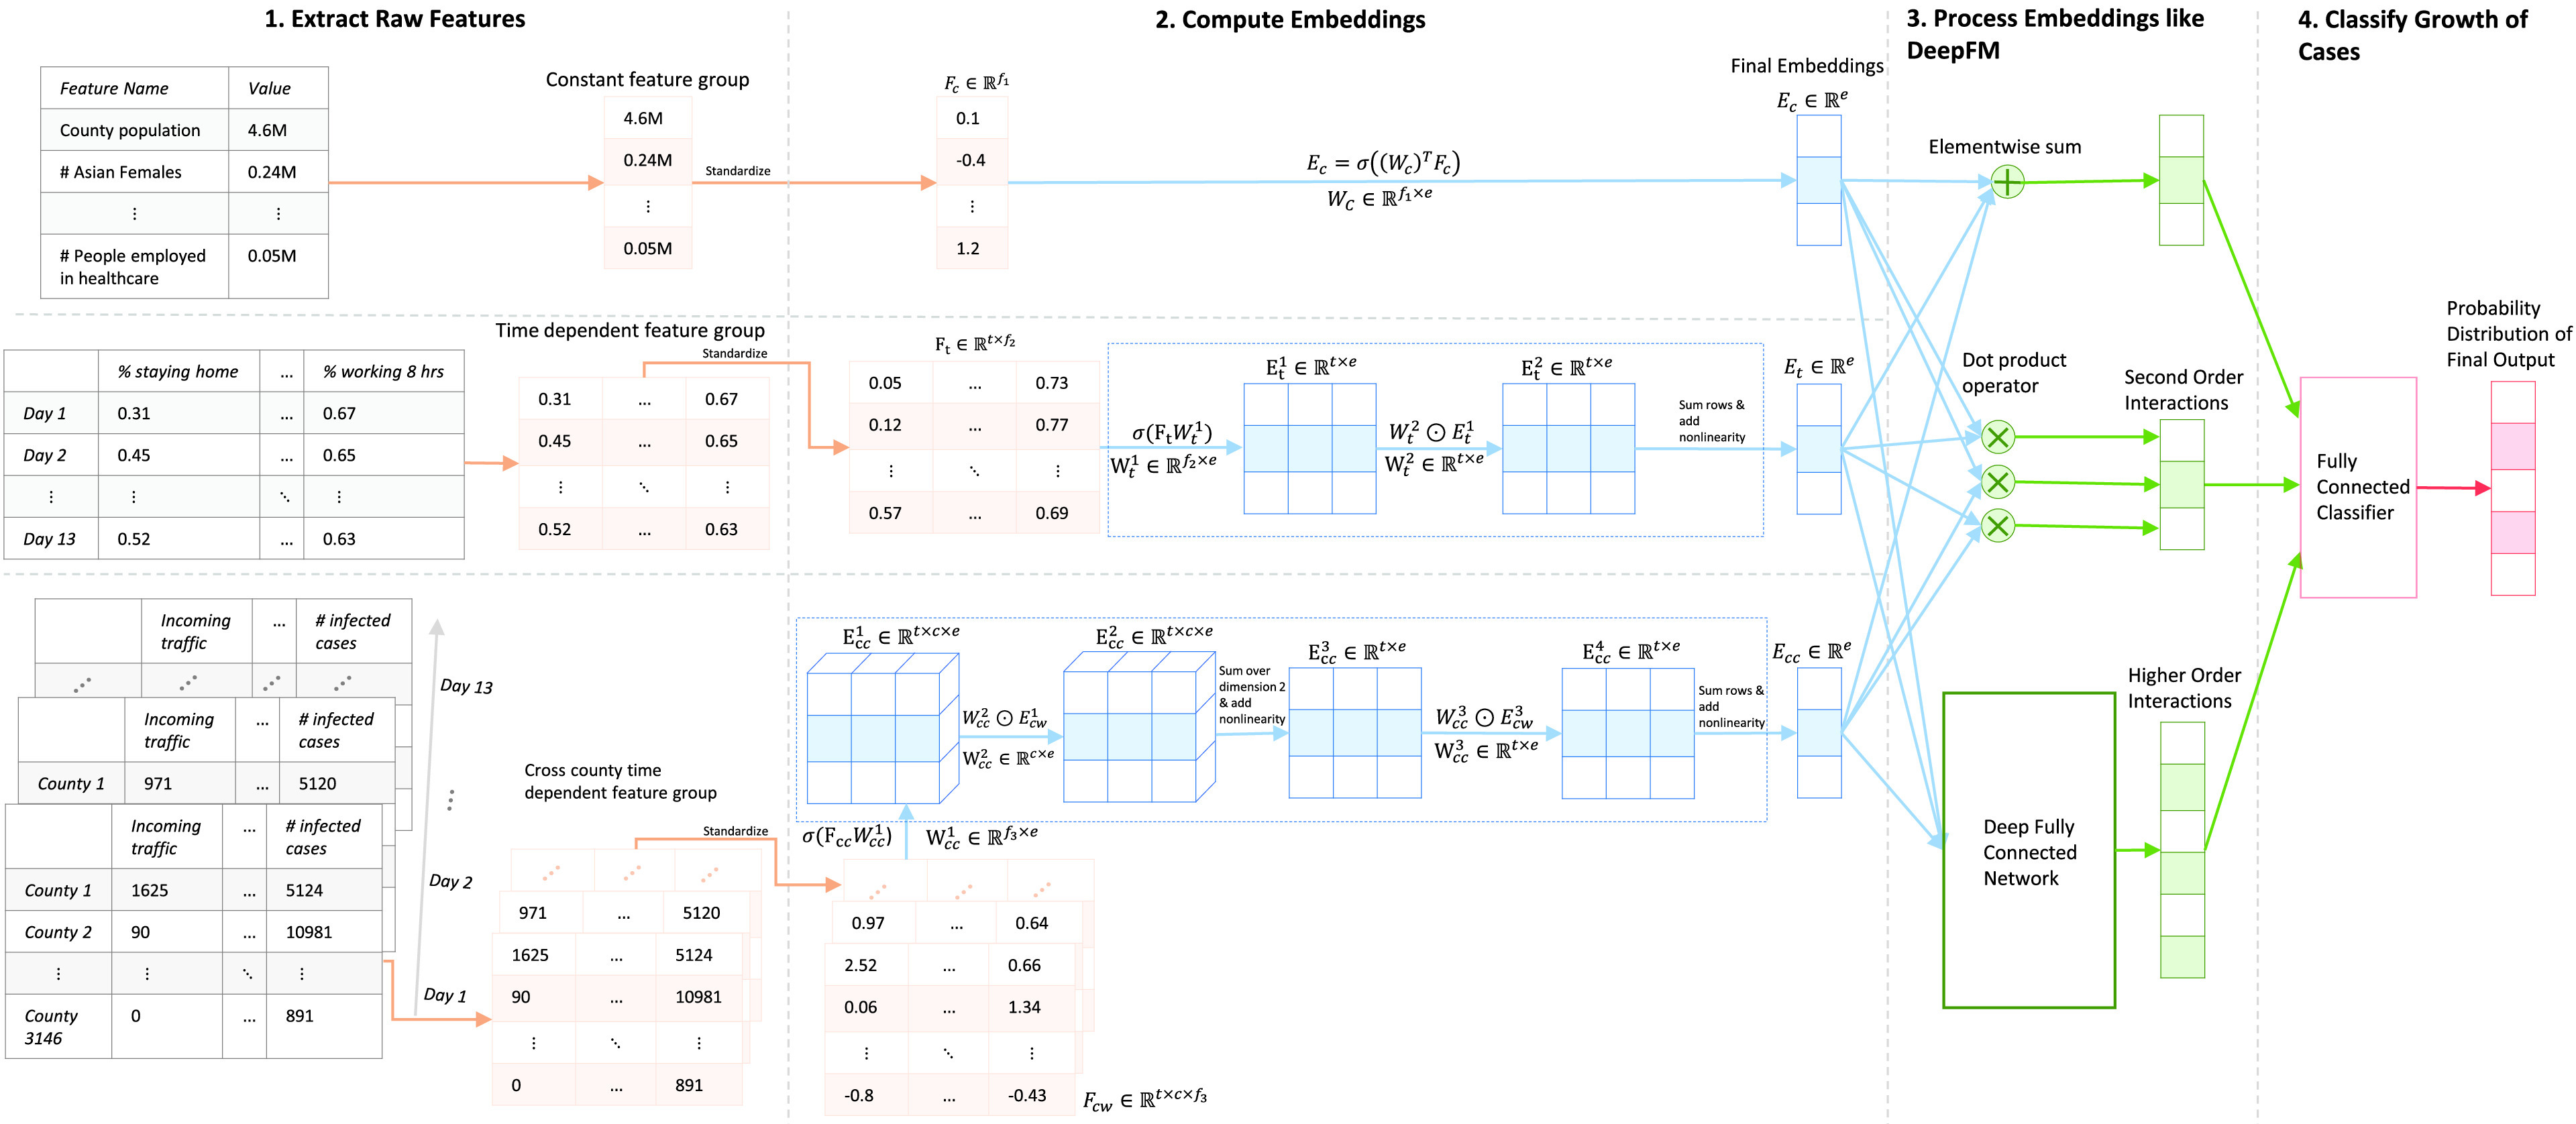
A schematic representation of the entire pipeline of the DeepCOVIDNet model which takes as input raw features and outputs a probability distribution to predict the range of the rise in infected cases in a given county on a given date in the future.  correspond to number of features,
  refers to the number of time steps (experimentally set to 13),
  refers to the number of counties (set to 3146),
  refers to the dimension of each embedding, and
  refers to any non-linearity. More explanation related to the tensor shapes is presented in Section IV-A.