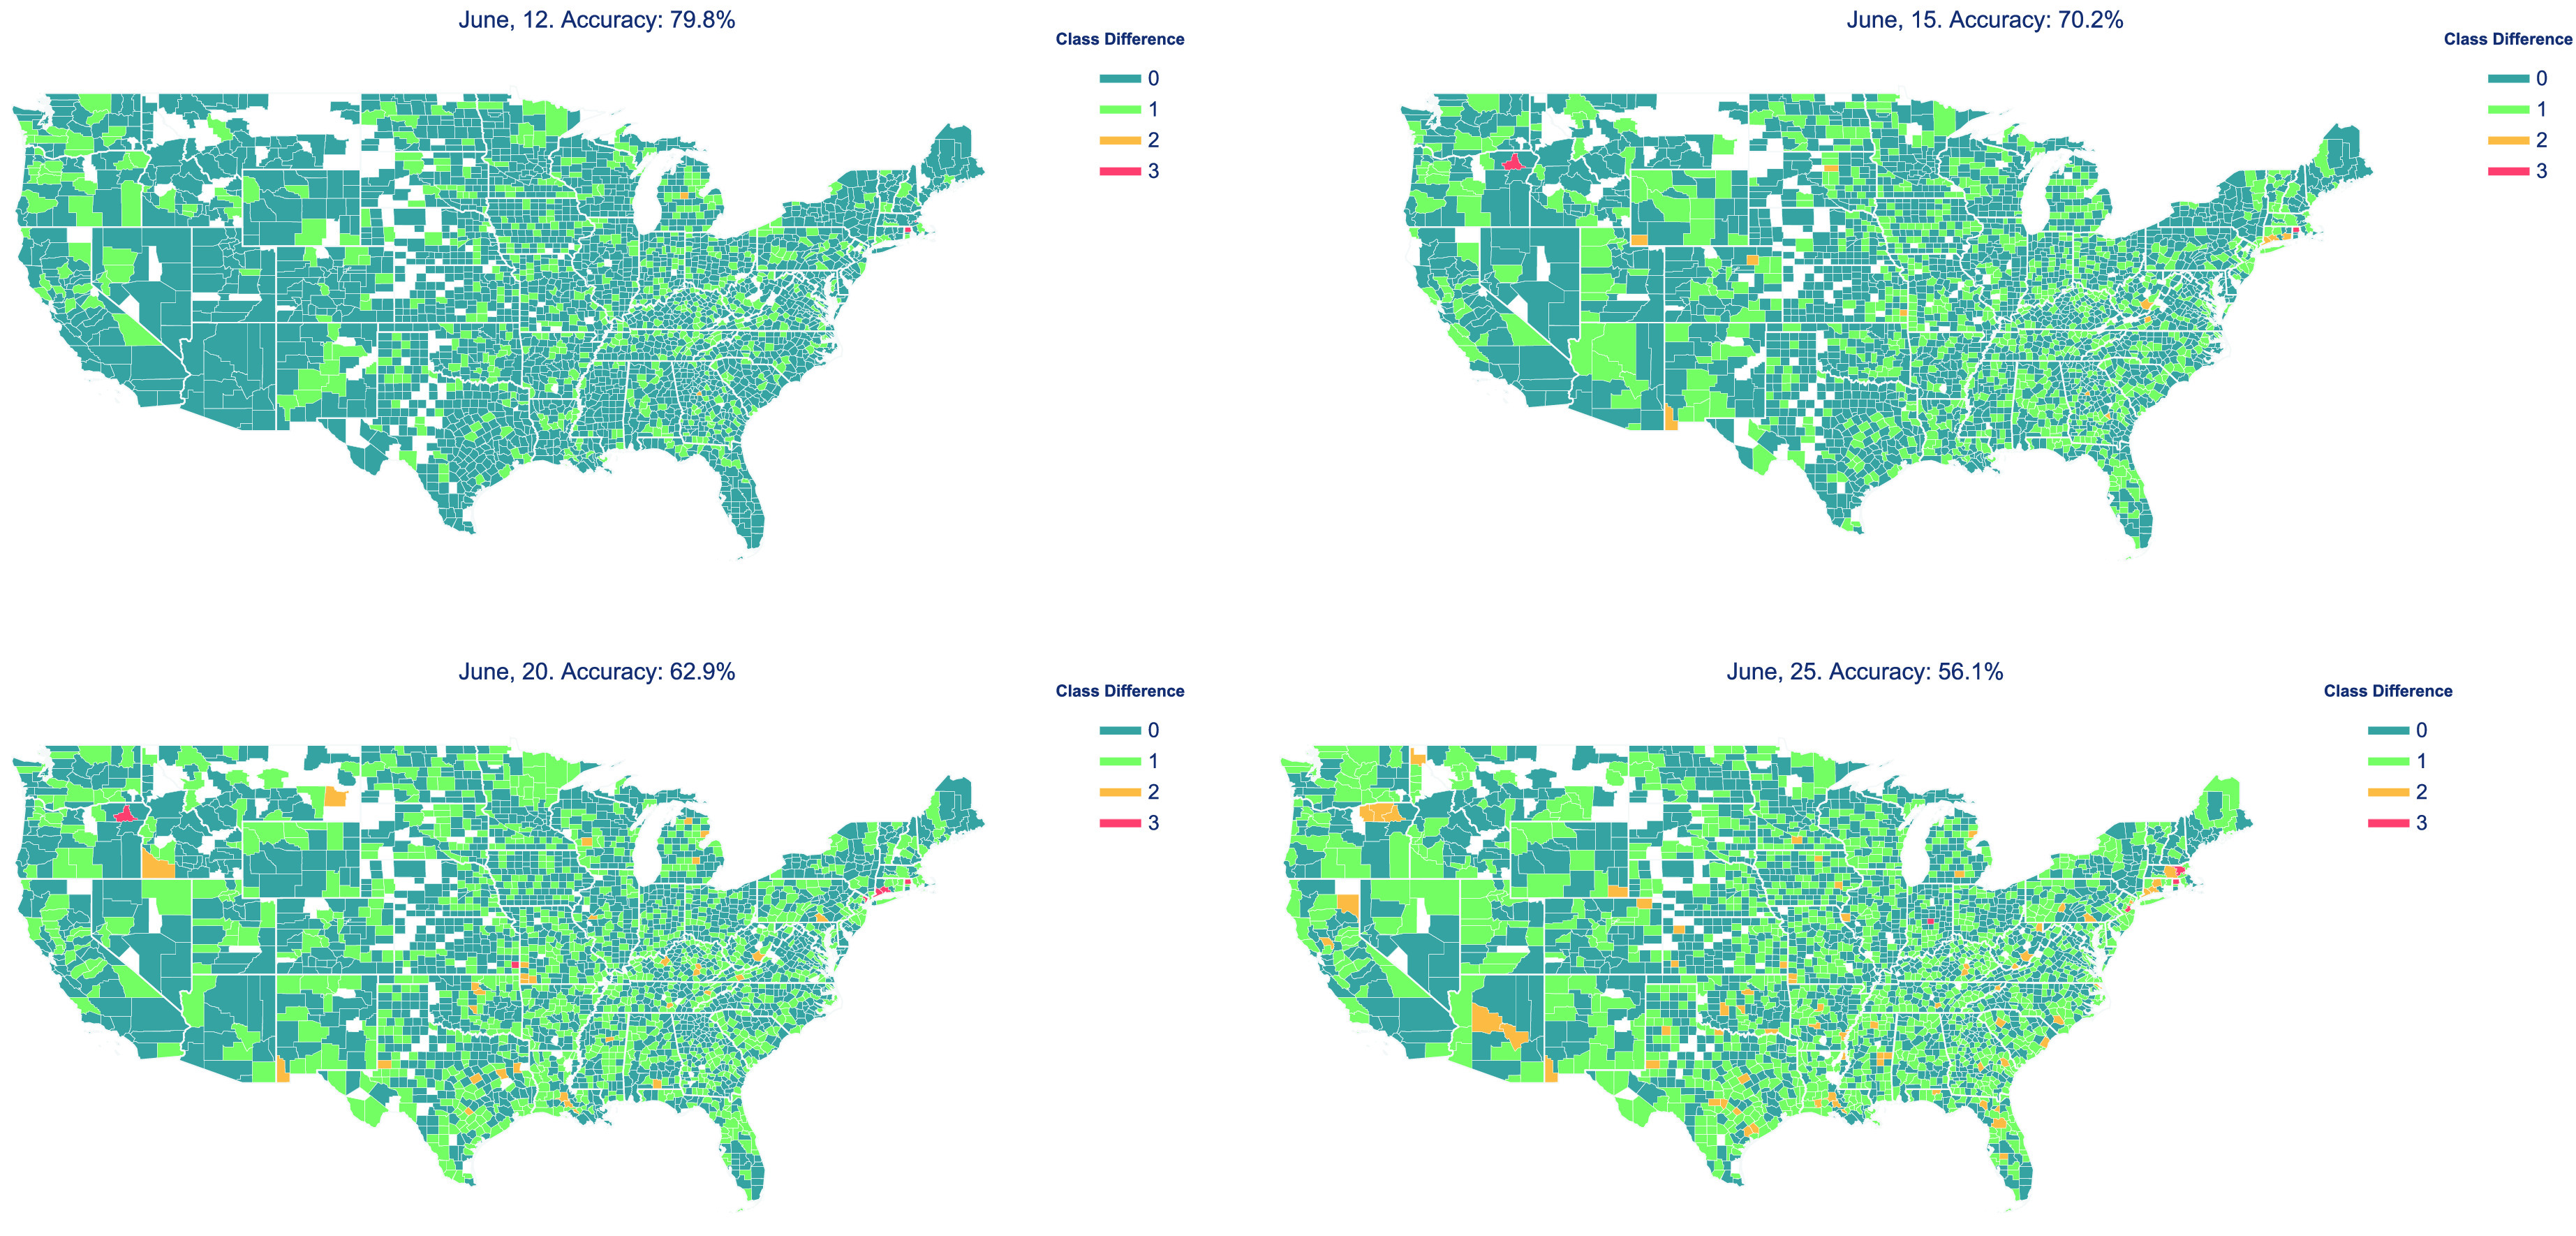
FIGURE 5.

Results showing the absolute difference in predicted class and the actual class for all counties (since classes are ordered). Therefore, the value of 0 means the model’s prediction was correct, 1 means it was one class away from ground truth, and so on. The accuracy of the model on the given date is shown above each subfigure. (The few counties not shown in these plots either have no infected cases or did not have sufficient data.)
