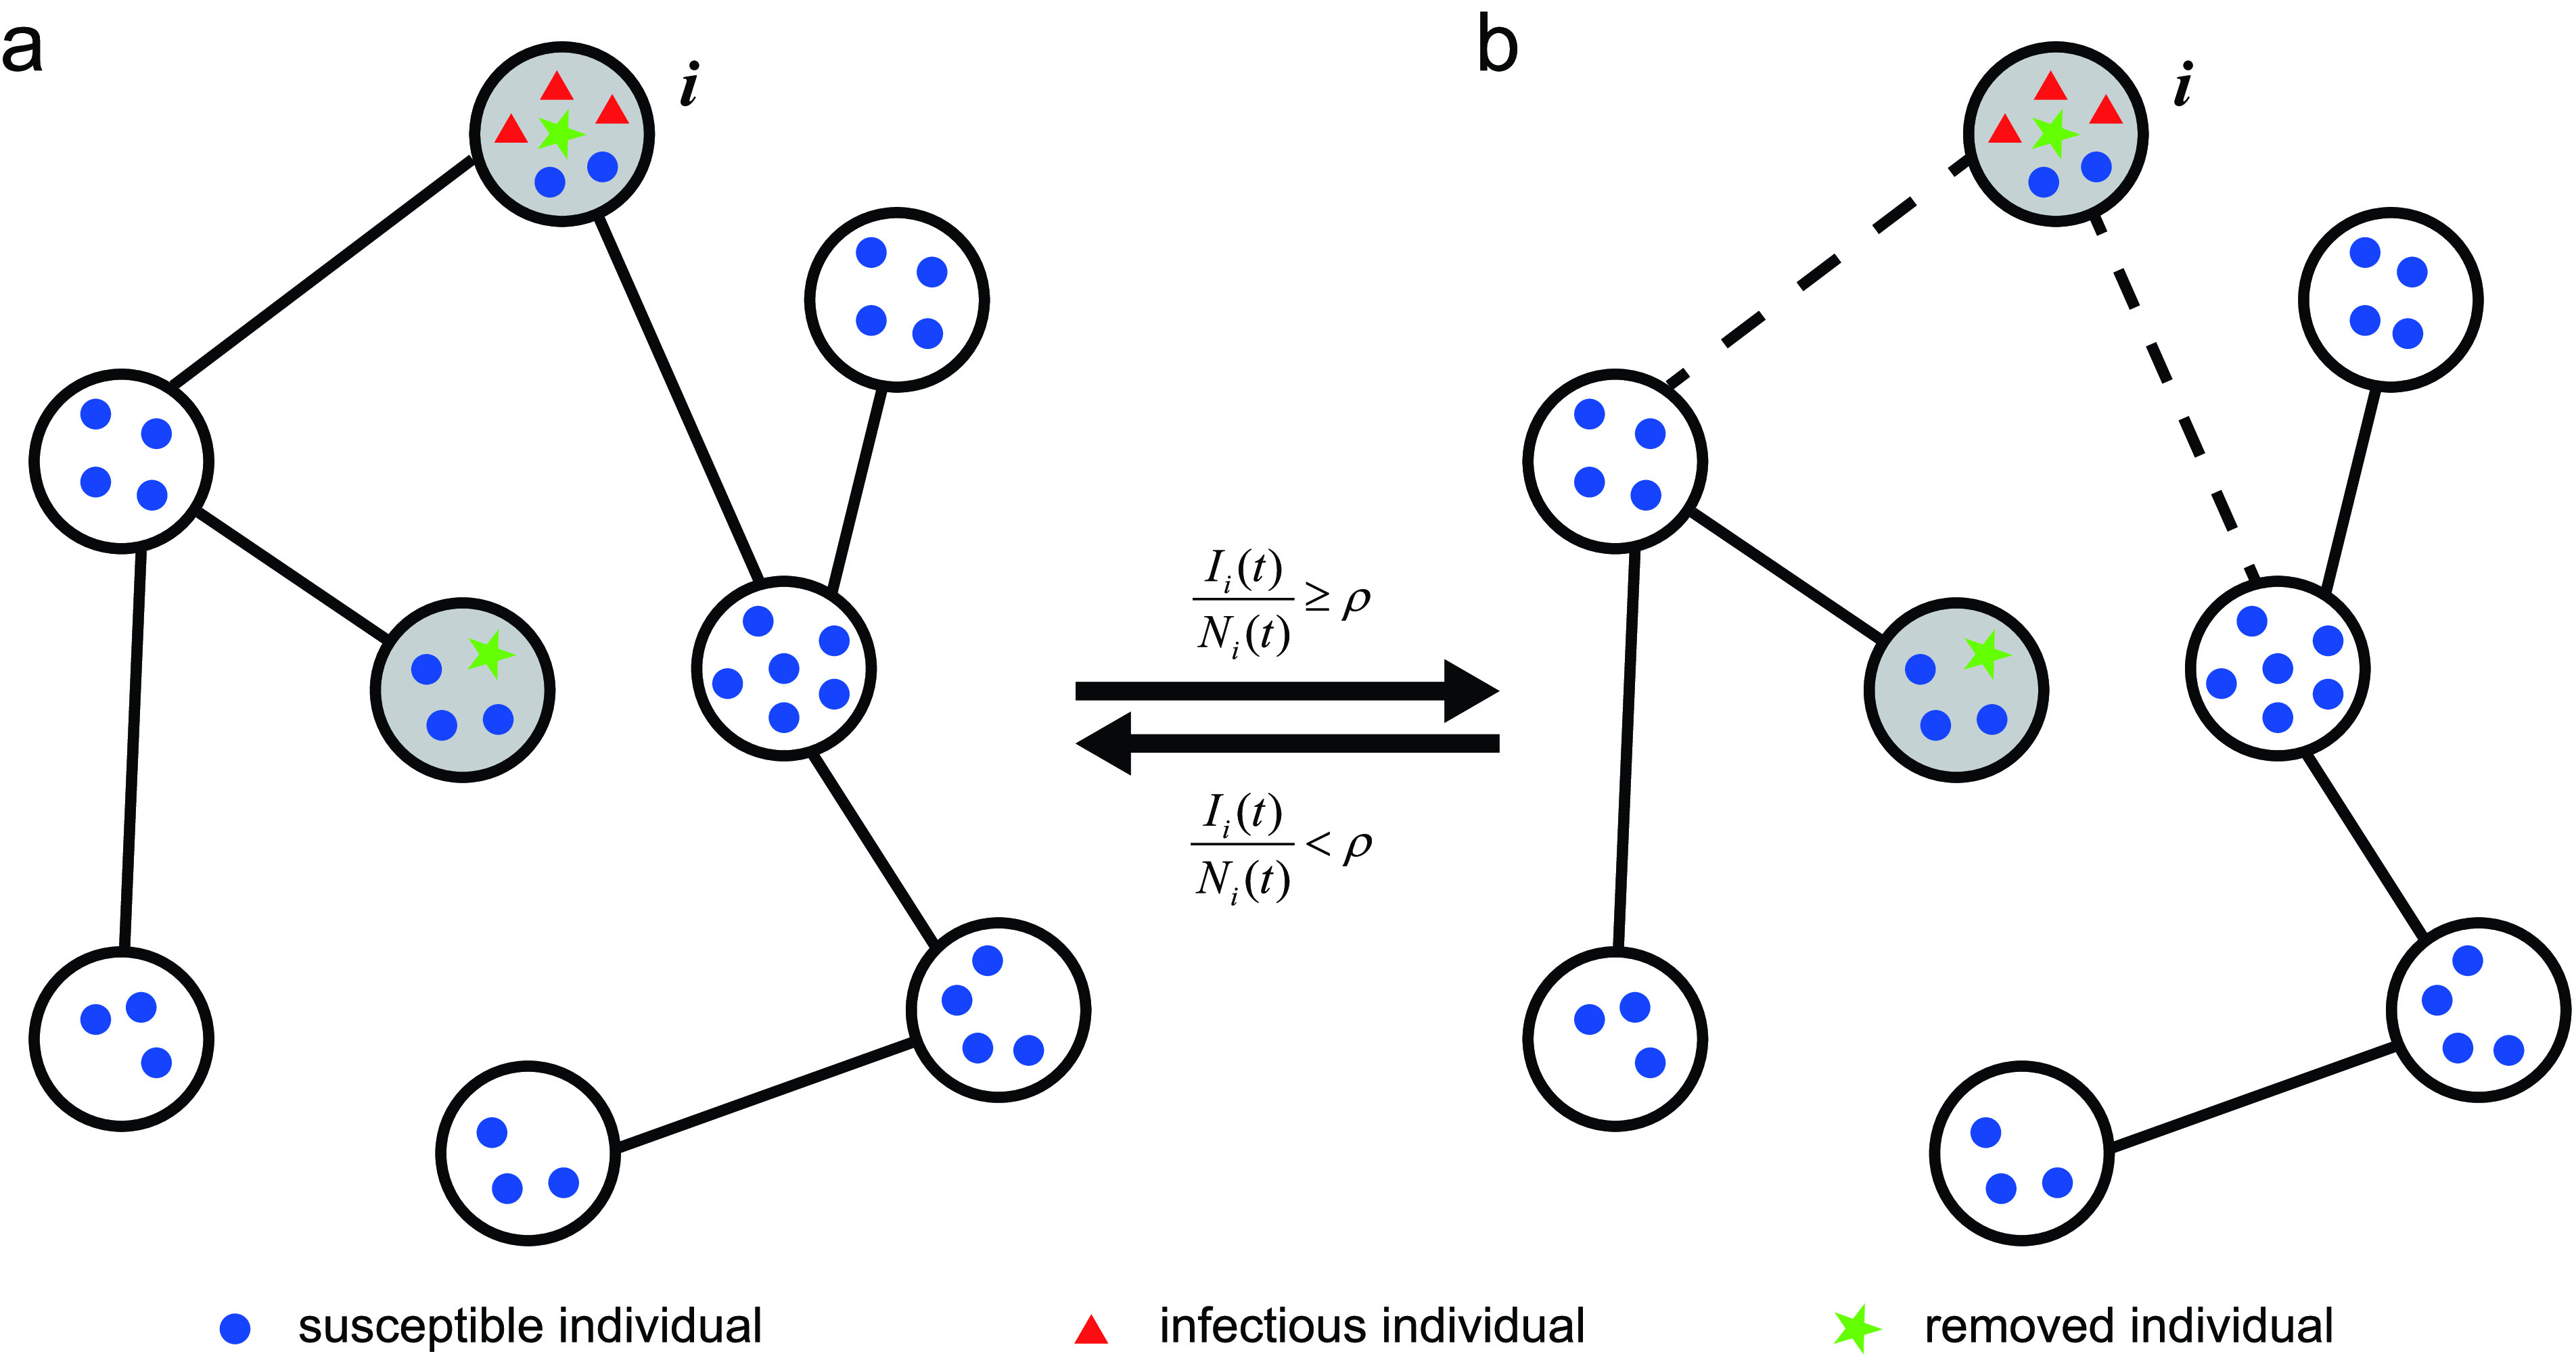
FIGURE 2.

The schematic depiction of an adaptive metapopulation network. Blue circles represent susceptible individuals, red triangles represent infectious individuals, and a green pentagram represents a removed individual. The dashed lines mean that there is no mobility of individuals between the two connected subpopulation, which is equivalent to broken links due to two-way travel restriction. The time  .
.
