FIGURE 4.

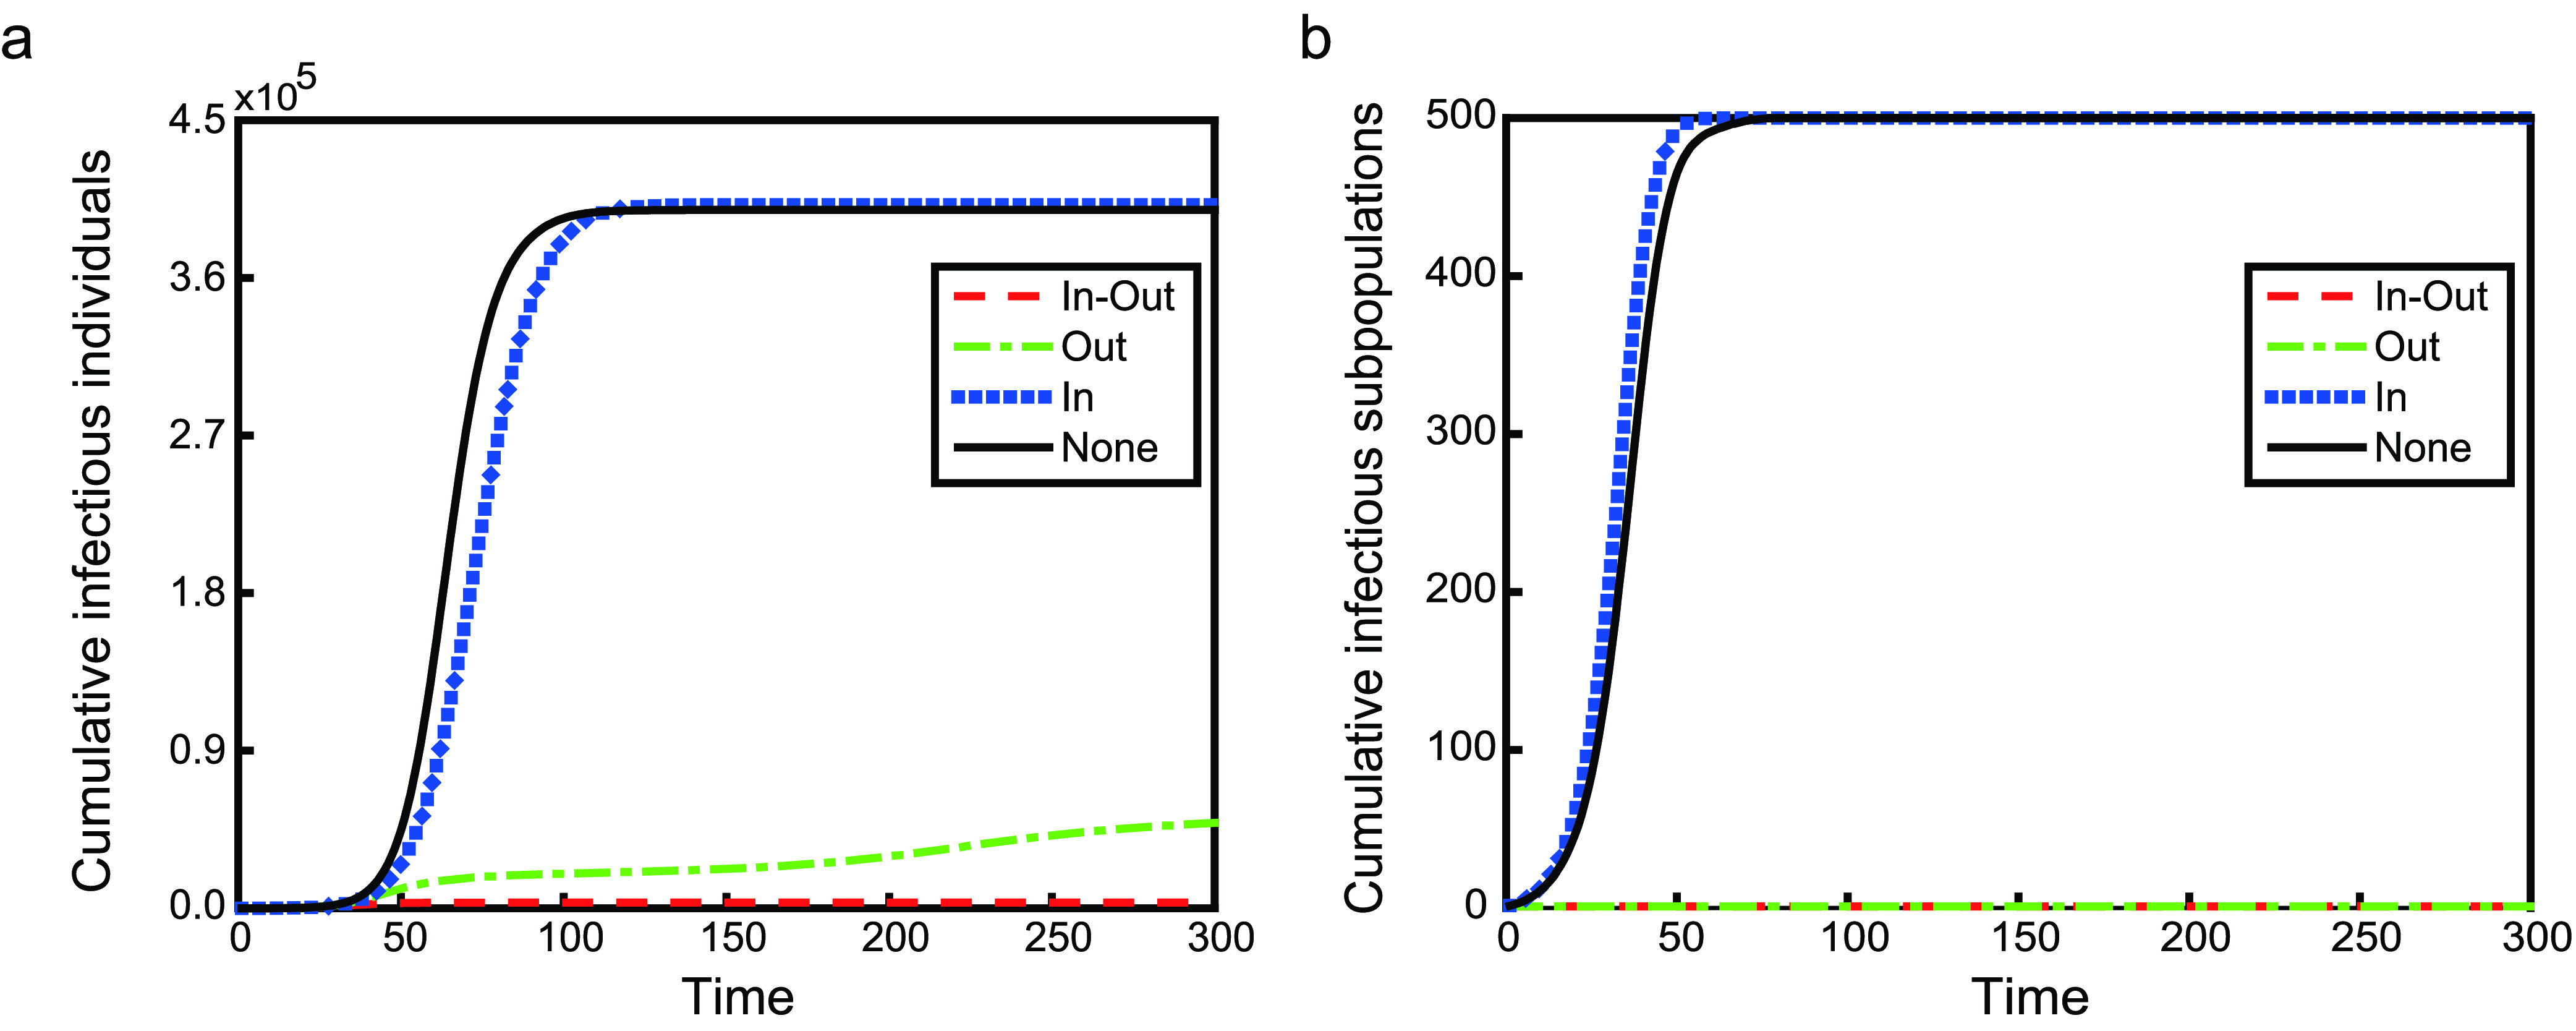
The time evolution of the number of cumulative infectious individuals and subpopulations on a power-law metapopulation network. Others are similar to Fig. 3.

The time evolution of the number of cumulative infectious individuals and subpopulations on a power-law metapopulation network. Others are similar to Fig. 3.