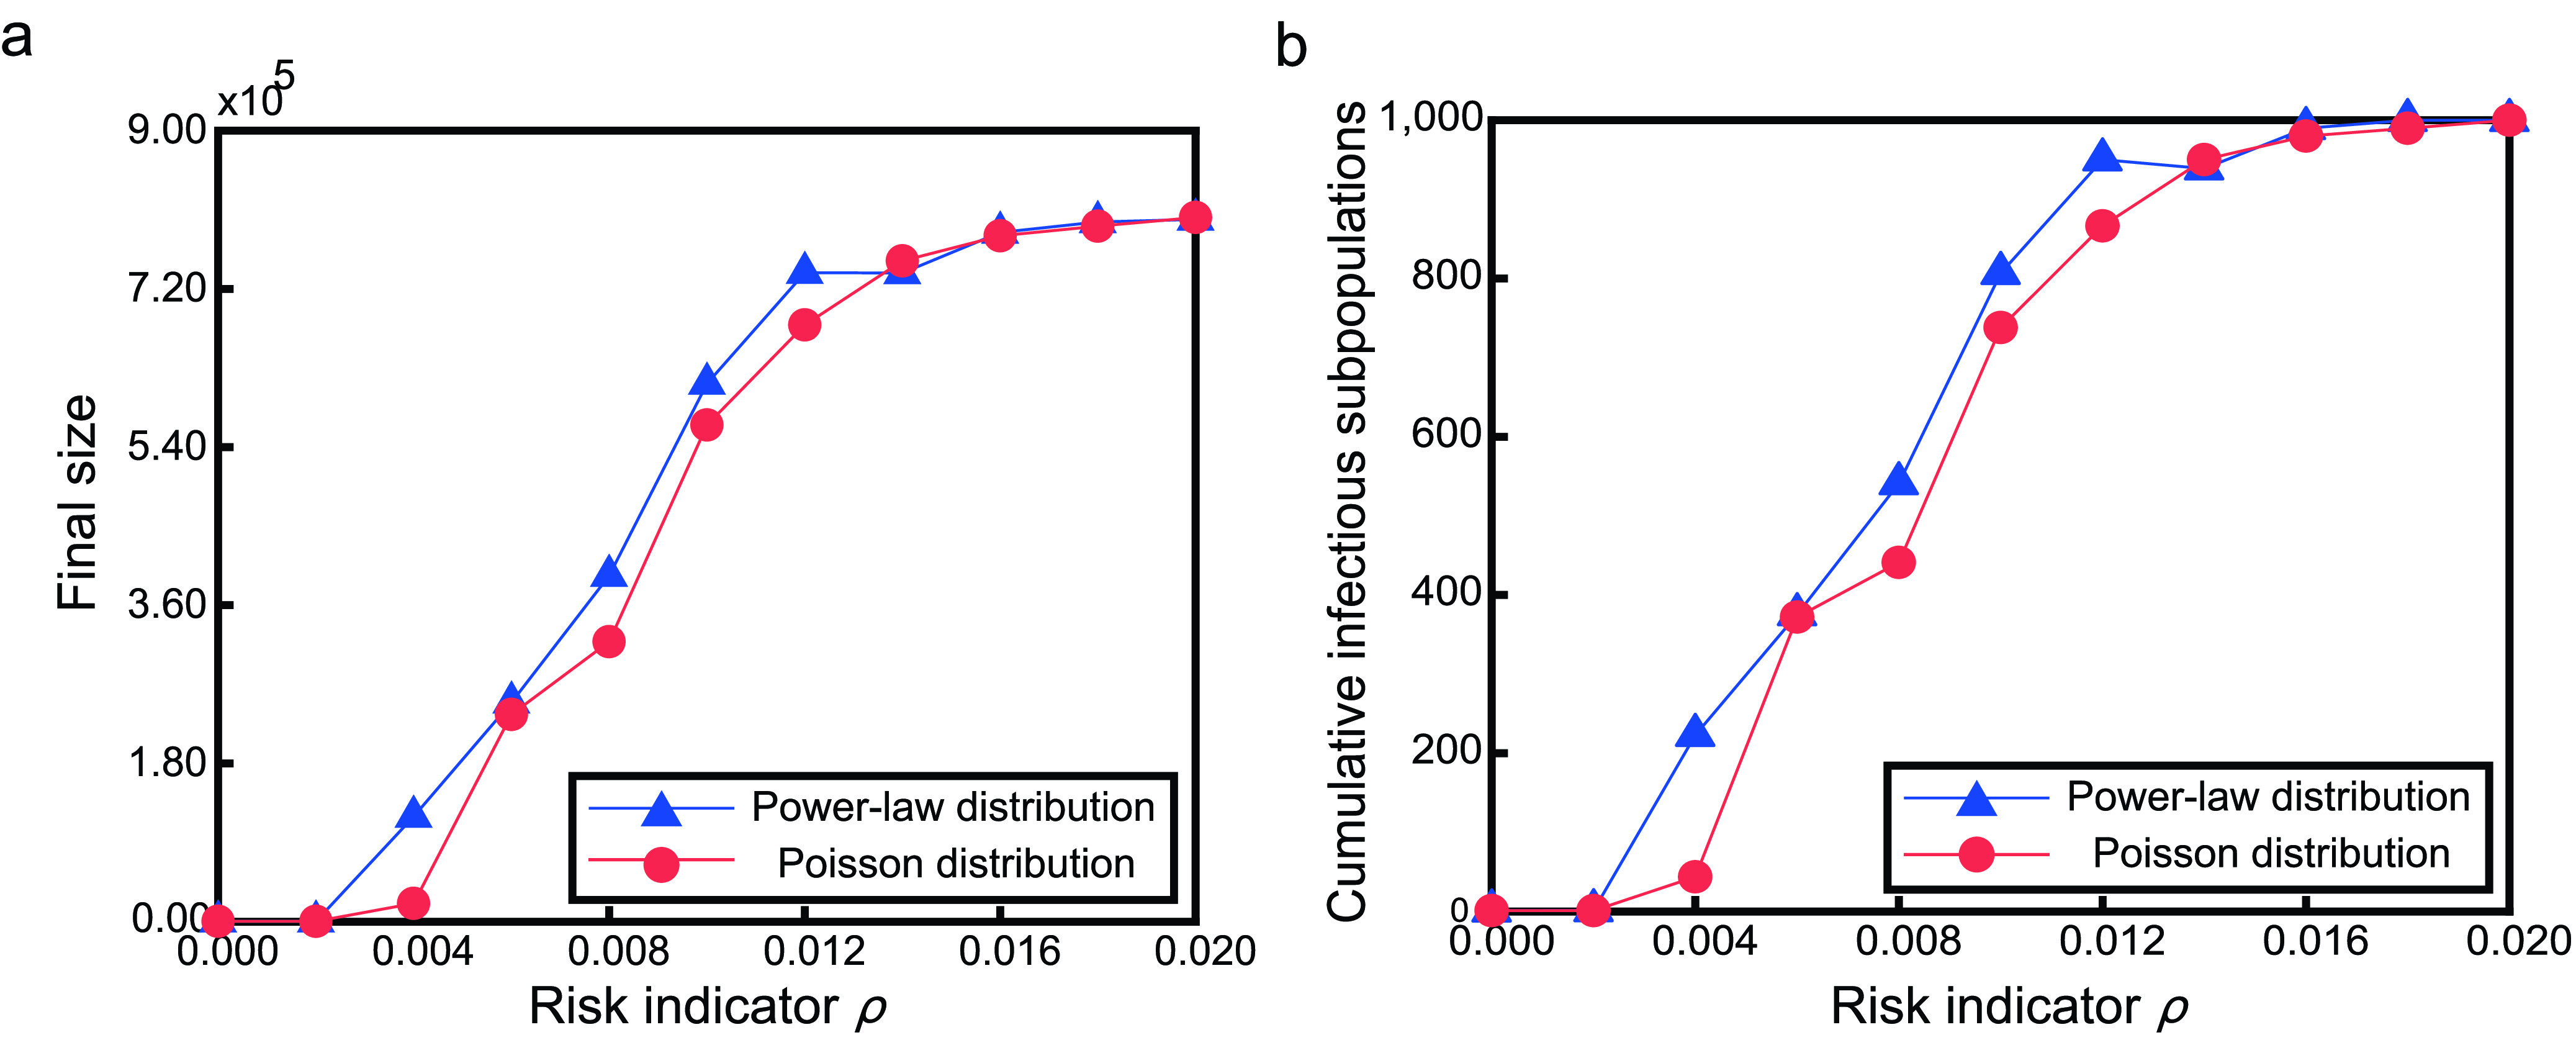
FIGURE 7.

The final size and the number of cumulative infectious subpopulations under different  . Figures are under two kinds of different adaptive metapoplation networks, red circles for poisson degree distribution and blue triangles for power-law degree distribution. The left panel shows the final size versus
  , while the right panel is the number of cumulative infectious subpopulations. Parameter
  .
.
