
FIGURE 8.
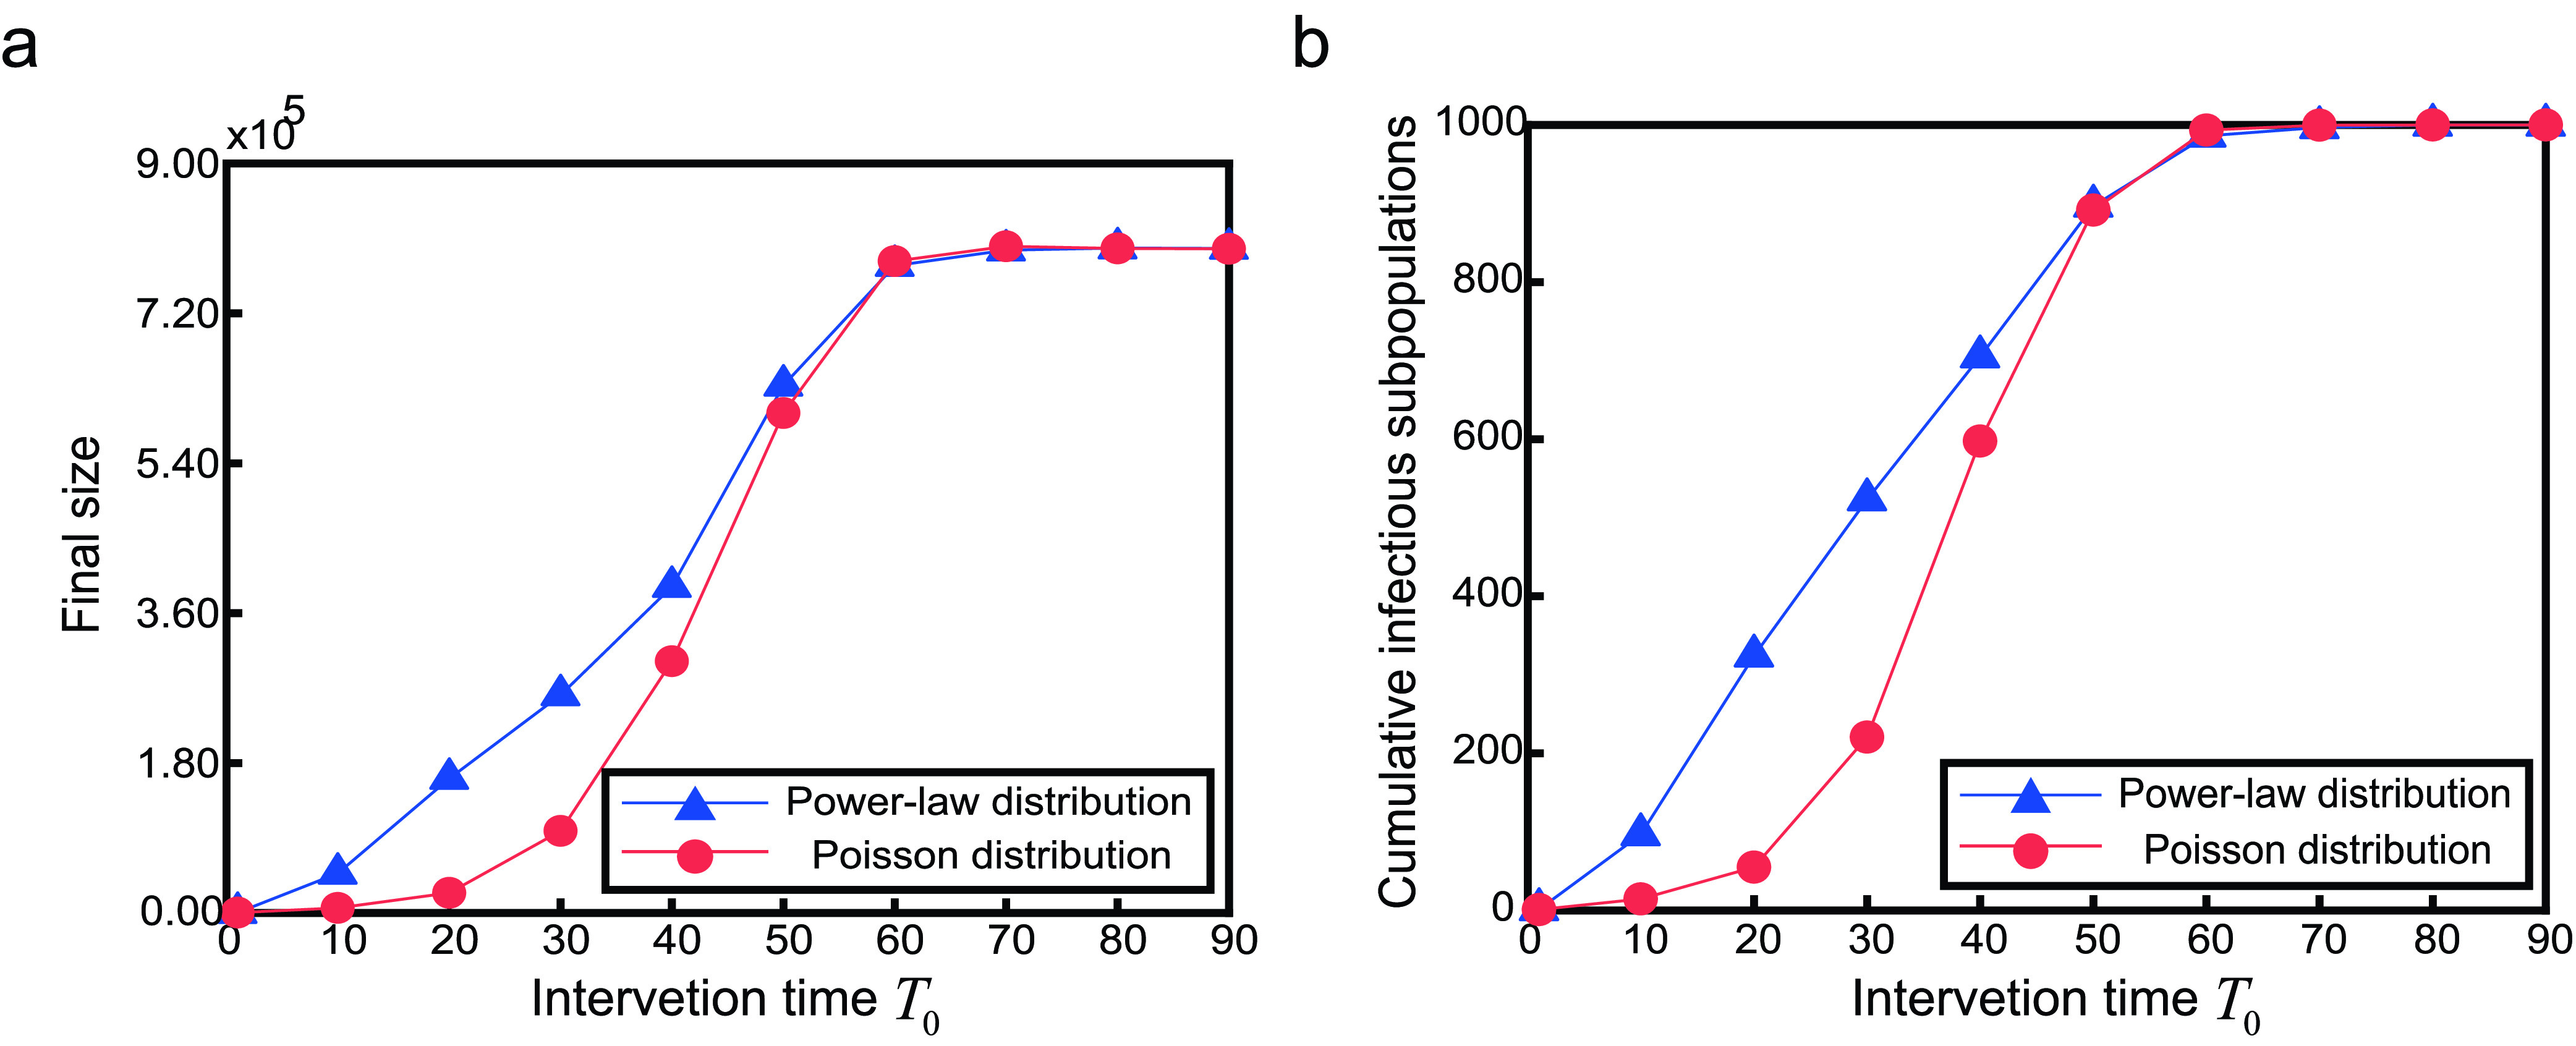
The effect of intervention time  on final size and cumulative infectious subpopulations. Parameter
  .
.
Official websites use .gov
A
.gov website belongs to an official
government organization in the United States.
Secure .gov websites use HTTPS
A lock (
) or https:// means you've safely
connected to the .gov website. Share sensitive
information only on official, secure websites.
The effect of intervention time on final size and cumulative infectious subpopulations. Parameter .