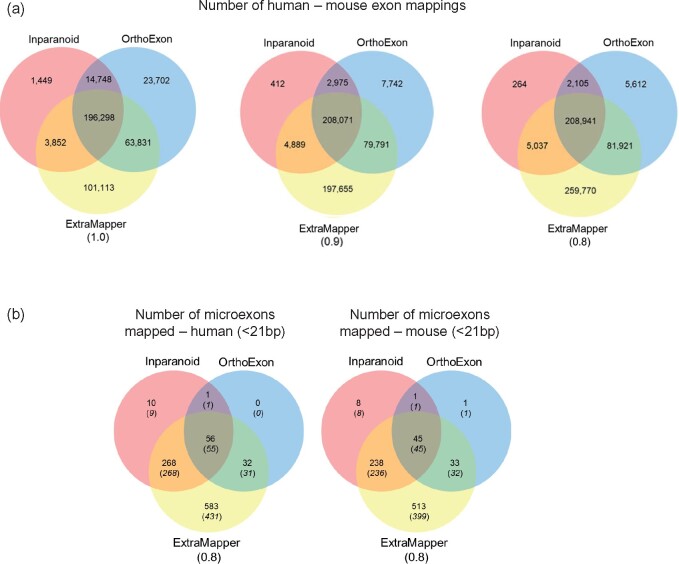
Fig. 2.
Summary of exon-level mapping results from three differ-ent computational approaches for human and mouse genome (a) for all exons, (b) for only microexons (<21bp). The results for the number of human (left) and mouse (right) microexons are shown separately. ExTraMapper exon similarity threshold is indicated for each Venn diagram

