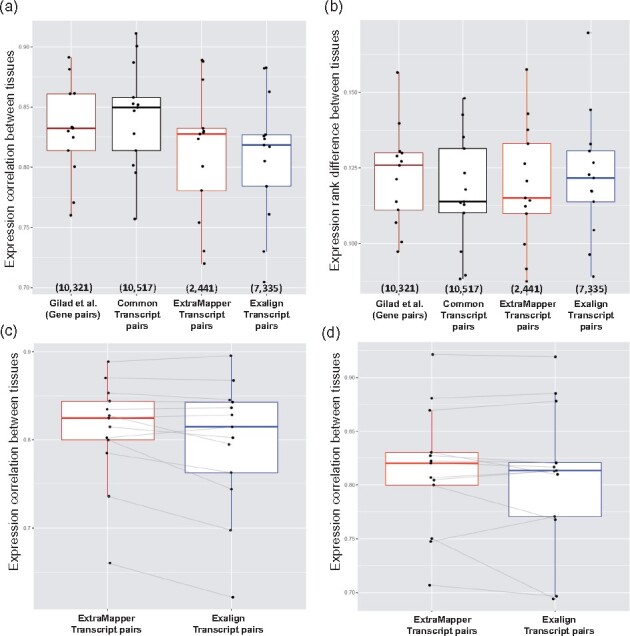
Fig. 4.

Reanalysis of tissue-matched human and mouse RNA-seq gene expression profiles. (a) Gene- and transcript-level expression correlation. (b) Gene- and transcript-level expression rank difference. (c) Gene- and transcript-level expression correlation for human tran-scripts where ExTraMapper and Exalign both report a single match-ing mouse transcript but their reported pairs are different from each other. (d) Similar plot to (c) but for mouse transcripts with a single matching human transcript. Each dot represents a specific tissue type
