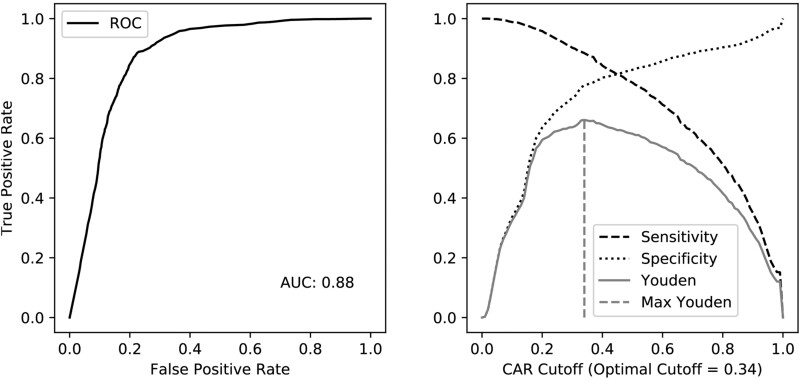
Fig. 3.
Sensitivity and specificity analyses. The ROC (left panel) curve shows the prediction of KEGG RPAIRS of type ‘main’ by CAR score from BNICE.ch. The right panel shows the tradeoff between specificity (black dashed line) and sensitivity (black dotted line). The Youden’s index (gray continuous line) reaches its maximum (0.66) at a CAR value of 0.34 (gray dashed line). ROC: Receiver operator characteristic, AUC: Area under the curve

