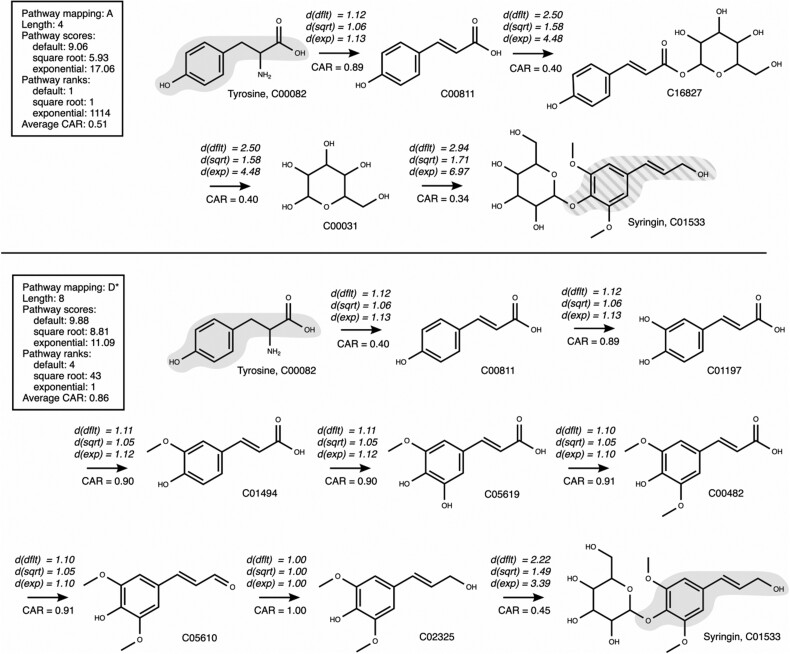
Fig. 5.
Comparison of two pathways (A and D*) from the pathway search connecting tyrosine to syringin. For each biotransformation, the CAR value along with the default distances for each transformation are indicated. (dflt): default distance, d(sqrt): square root transformation, d(exp): exponential transformation. The tyrosine moiety is marked in gray if conserved from tyrosine to syringin, and gray striped if entering from co-substrates

