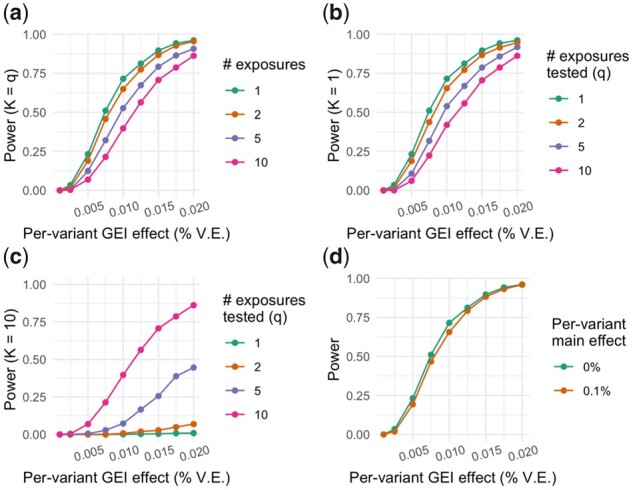
Fig. 1.

Power of the interaction test from the GEM method. Statistical power is shown on the y-axis reflecting the fraction of interaction tests with P < 5 10−8 (calculated based on 1000 tests). (a) Total interaction effect (x-axis), in terms of phenotypic variance explained, is partitioned equally among K exposures (K = 1, 2, 5 and 10), and an interaction test for q exposures jointly, the exact set of K exposures, is performed (q = K). (b) One exposure is responsible for the full interaction effect (K = 1), and q is varied (q = 1, 2, 5 and 10). (c) Total interaction effect is partitioned equally among 10 exposures (K = 10), and q is varied within subsets of these 10 exposures (q = 1, 2, 5 and 10). (d) As in (a), with a single exposure simulated and tested, but varying the strength of the genetic main effect. GEI, gene–environment interaction; % V.E., percent variance explained
