. 2021 Oct 12;10:e70910. doi: 10.7554/eLife.70910

Figure 1. Experimental design and metrics and CFU dynamics.

(A) The experimental schematic depicts the extraintestinal pathogenic Escherichia coli (ExPEC) barcoded library as colored bacteria, where colors indicate unique barcodes; the library was injected intravenously (i.v.) into mice, after which organs were harvested, homogenized, and plated for enumeration of CFU. Bacterial cells were scraped, pooled, and the barcode abundances in the output populations were quantified. The distributions of the barcodes (far-right graph) define the population structure of the organ, schematized in (B–E). (B–E) Graphical depiction of populations with different combinations of Nb and Nr values. These populations arise from (B) a tight bottleneck and subsequent expansion of purple cells, (C, D) a wider bottleneck and expansion of purple (C) or red (D) cells and (E) a wide bottleneck and even growth of all cells. Metrics used for comparisons between samples (genetic distance [GD], “resilient” genetic distance [RD], and fractional RD [FRD]) are indicated. (F) CFU recovered from select organs on days 0–5; the full CFU data set is provided in Figure 1—figure supplements 24. Points with the same fill and border color were obtained from the same animal. Arrows pointing to G–J correspond to the points where complete barcode frequency distributions are shown below (in G–J). (G–J) Barcode distributions and Nb and Nr values are shown. Red lines separate populations that were distinguished by the Nr algorithm (Hullahalli et al., 2021). Blue line indicates the algorithm-defined threshold for noise. Percentages represent the relative abundance of barcodes within each region. G and H represent examples with highly abundant barcodes that skew Nb values lower. (G) reproduced from Figure S5B (Hullahalli et al., 2021).

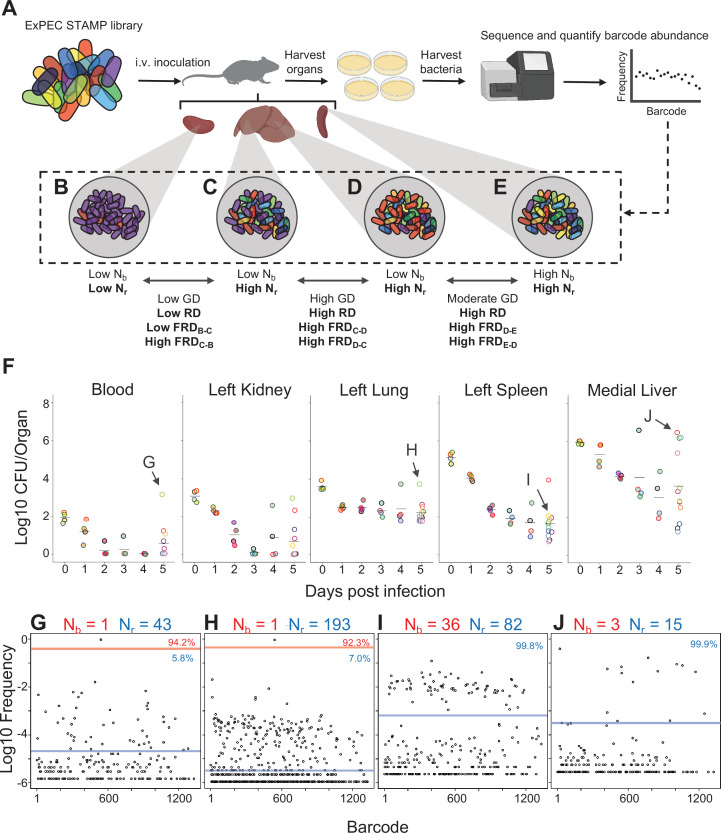
Figure 1.

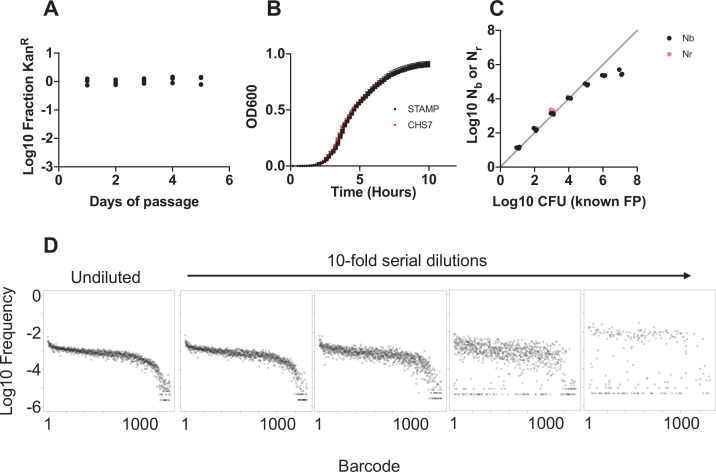
Figure 1—figure supplement 1. Barcode stability and creation of the STAMPR standard curve.

Figure 1—figure supplement 1.

(A) The barcoded library was serially passed in LB lacking antibiotic. Each day, colonies containing barcodes were enumerated as a fraction of the kanamycin-resistant cells. In addition, every day, 30 single colonies derived from the serially passaged culture were grown on plates lacking kanamycin and then patched onto media containing kanamycin. All colonies retained the antibiotic resistance marker, suggesting that the barcode is stable for at least ~50 generations. (B) Growth curves of nine individual barcoded clones (STAMP) and the WT untagged strain (CHS7) were indistinguishable, indicating that the tags do not confer a growth defect. (C) Sequencing of the barcodes at different known bottleneck sizes (plated serial dilutions of the barcoded library) showed that both Nb and Nr accurately reflect founding population (FP) values up to 105 – corresponding to the approximate sequencing depth of the sample. The underlying barcode distributions that result from the serial dilutions are shown in (D).
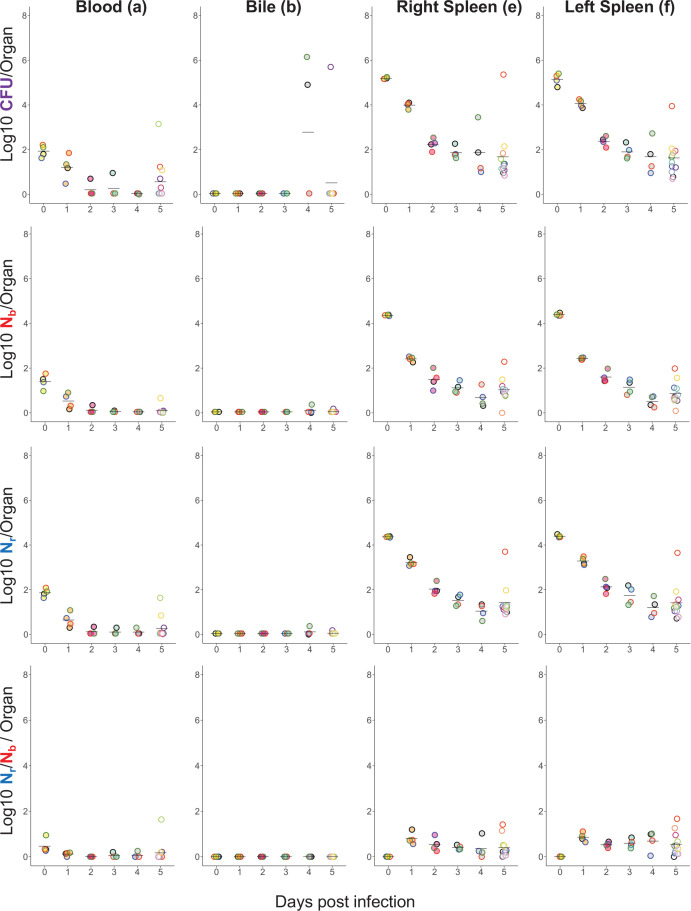
Figure 1—figure supplement 2. Longitudinal CFU, Nb, and Nr measurements from the blood, bile, and spleen.

Figure 1—figure supplement 2.

Points with the same fill and border color are from the same animal; the same fill and border coloring scheme is used for the animals shown in Figure 1—figure supplement 3 and Figure 1—figure supplement 4.
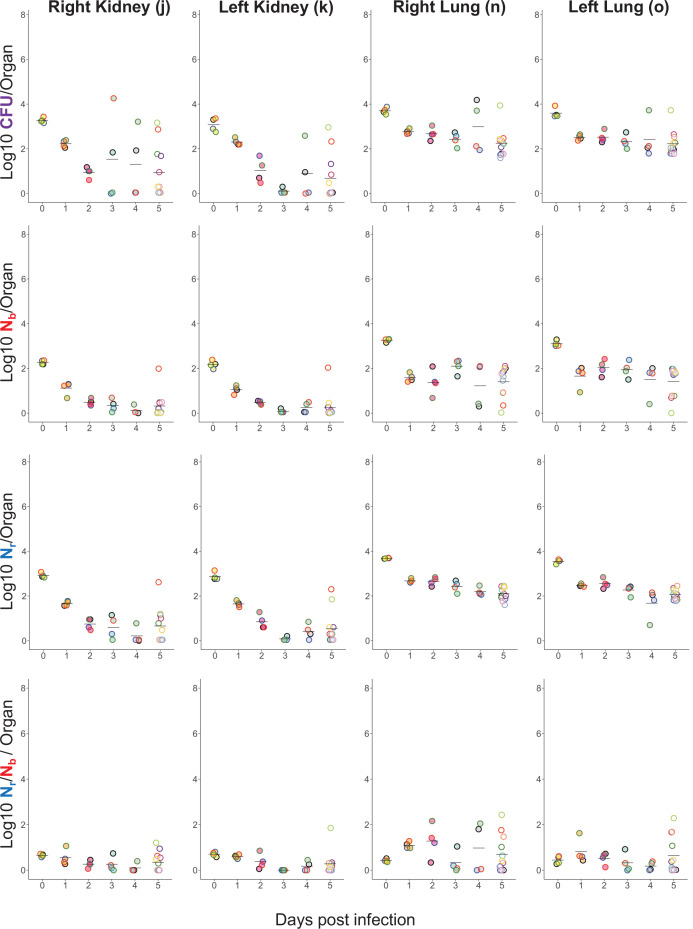
Figure 1—figure supplement 3. Longitudinal CFU, Nb, and Nr measurements from the lungs and kidneys.

Figure 1—figure supplement 3.

Points with the same fill and border color are from the same animal and correspond to animals shown in Figure 1—figure supplement 2 and Figure 1—figure supplement 4.
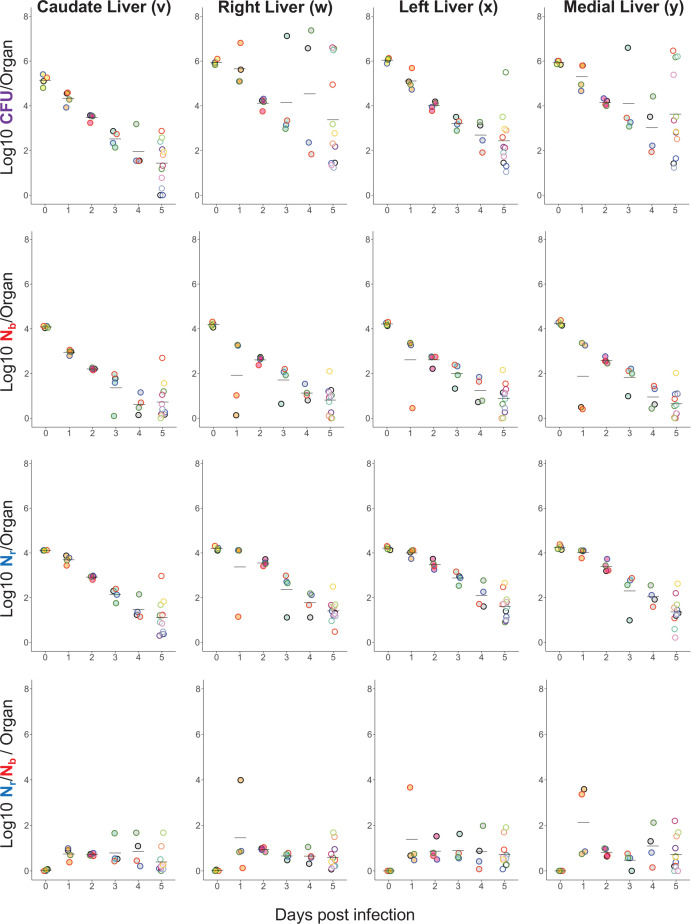
Figure 1—figure supplement 4. Longitudinal CFU, Nb, and Nr measurements from the liver.

Figure 1—figure supplement 4.

Points with the same fill and border color are from the same animal and correspond to animals shown in Figure 1—figure supplement 2 and Figure 1—figure supplement 3.