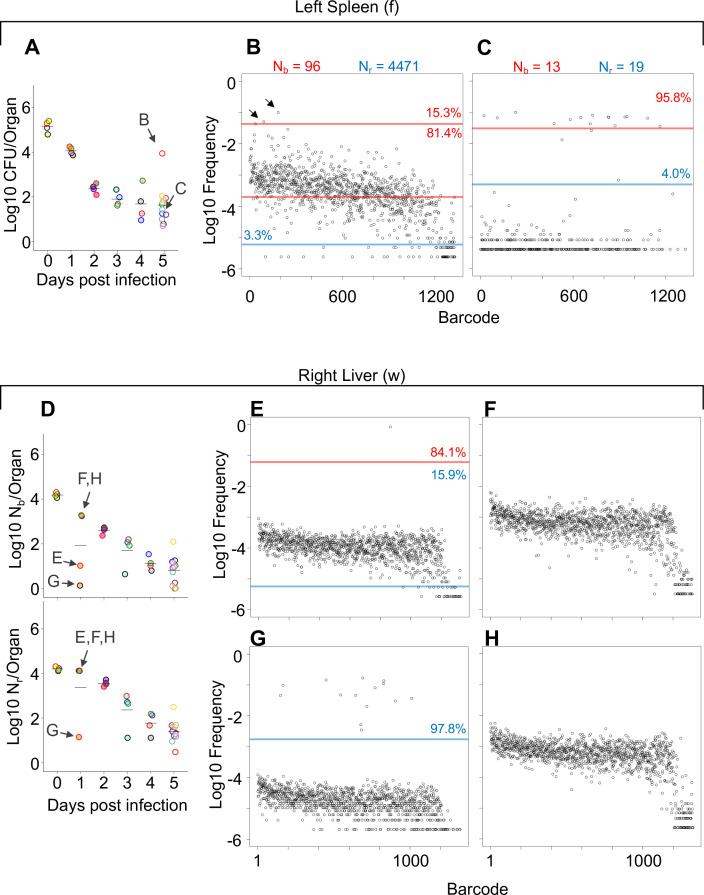
Figure 2. Comparisons of barcode distributions in animals with or without clonal expansion events.
(A) CFU from the left half of the spleen 5 days post infection (dpi); points with the same fill and border color are derived from the same animal. (B, C) The underlying barcode distribution found in animals B and C are shown in the respective graphs on the right. The highly increased bacterial burden in animal B relative to animal C can be attributed to both a wider bottleneck and clonal expansion. In the barcode frequency distribution shown in (B), a diverse population is evident, as is the clear expansion of a few clones (arrows). In contrast, in animal C, Nb and Nr are similar to CFU, suggesting that the population has undergone relatively little replication. (D) Nb and Nr plots from the right lobe of the liver 1 dpi. The underlying barcode distributions in animals E, F, G, and H are shown in the respective graphs to the right (in E–H). Animals E and G have clonal expansion events; expansion is so substantial in (G) (~98% of reads) that the algorithm cannot distinguish the underlying population from noise, and Nr is not substantially higher than Nb for this sample. In contrast, Nr can identify this population in sample E. Red and blue lines denote subpopulations and noise, as in Figure 1.


