. 2021 Oct 12;10:e70910. doi: 10.7554/eLife.70910

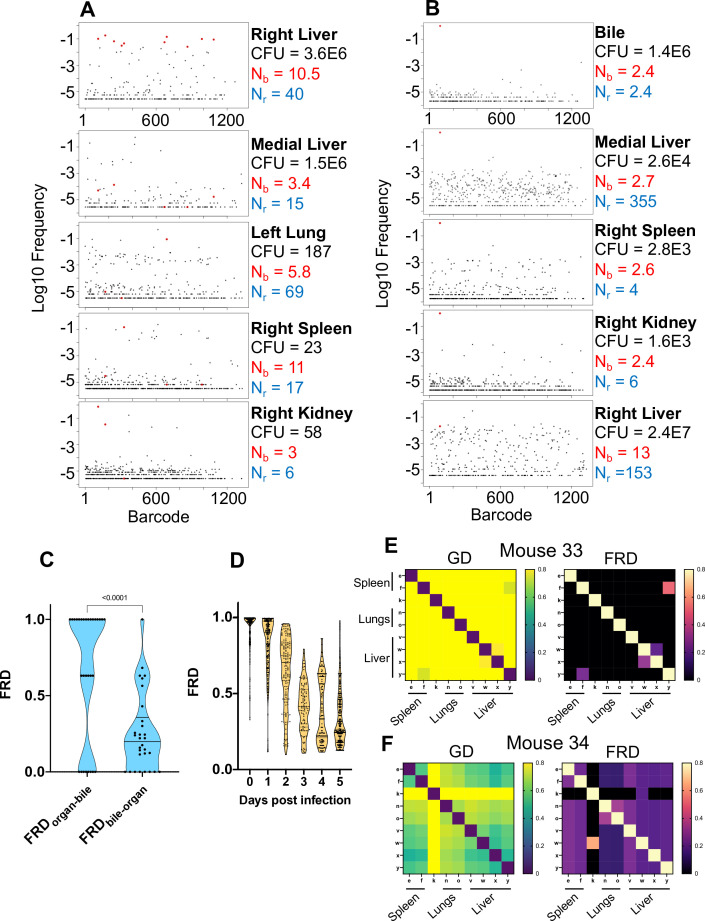
Figure 3. Visualizing dissemination patterns.

(A) Barcode frequency distribution from the right lobe of the liver in a single animal (mouse 24) is shown. This lobe harbored an abscess, which is reflected in the large bacterial burden. The top 10 barcodes are highlighted in red and identified in the four organs below. The relative absence of these dominant barcodes in the other organs reveals that the clones in the abscess did not substantially disseminate to other organs. GD and FRD values resulting from these comparisons are shown in Figure 3—figure supplement 6. Nr and Nb values are shown adjacent to each sample. (B) Same as (A) but where the top barcode frequency distribution is from the bile of mouse 20. The most dominant clone is highlighted in red and identified in other organs below. This clone is also dominant in other organs with the exception of the right lobe of the liver, where the clones within an abscess are dominant. (C) FRD values resulting from organ comparisons with the bile in all animals with bile CFU (mice 17, 20, and 31). Significantly lower FRD values (Mann–Whitney) when the non-bile organ is set to the reference (FRDbile-organ) reveal that the non-bile organ harbors a more substantial nontransferred population, particularly exemplified by liver samples in panel (B). (D) FRD values for all organs, omitting FRD values of 0 (no detectable relatedness) and 1 (self-organ comparisons). This panel summarizes and quantifies the increasingly purple colors observed across Figure 3—figure supplements 16. The significant decrease in FRD (Spearman’s r = –0.7, p<0.0001) indicates that relatedness becomes driven by fewer clones over time. (E, F) Heatmaps of GD (left) and FRD (right) are displayed for mouse 33 (C) and mouse 34 (D). Lower GD values in mouse 34 indicate substantially more sharing of bacteria than in mouse 33. Low FRD values across all organs in mouse 34 reveal that only a few barcodes (i.e., clones) are being shared. FRD = 0 for most organs in mouse 33 because no clones are shared. In (E, F), organs displayed are the right spleen (e), left spleen (f), left kidney (k), right lung (n), left lung (o), caudate liver (v), right liver (w), left liver (x), and medial liver (y). Column names in FRD heatmaps represent the organ used as the reference. Heatmaps for all mice and all time points are shown in Figure 3—figure supplements 16.

Figure 3.

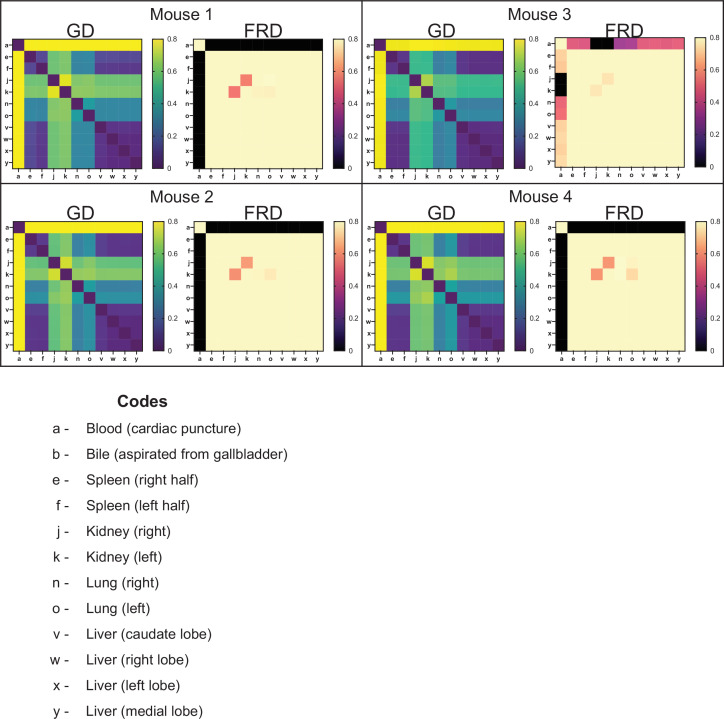
Figure 3—figure supplement 1. Genetic distance (GD) and fractional resilient genetic distance (FRD) 4 hr post infection (hpi) (0 day post infection [dpi]).

Figure 3—figure supplement 1.

GD heatmaps are shown on the left, and FRD heatmaps are shown on the right. Column names for FRD correspond to the reference sample. Organ codes are blood (a), bile (b), right spleen (e), left spleen (f), right kidney (j), left kidney (k), right lung (n), left lung (o), caudate liver (v), right liver (w), left liver (x), and medial liver (y). In these animals, low GD values are reflective of their very high Nb values as all samples are closely related to the inoculum. This is consistent with high FRD values.
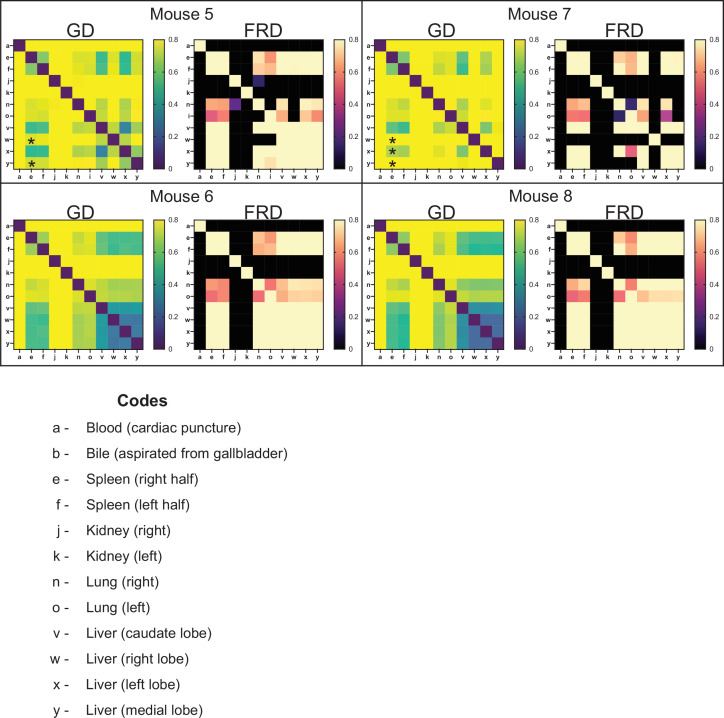
Figure 3—figure supplement 2. Genetic distance (GD) and fractional resilient genetic distance (FRD) 1 day post infection (dpi).

Figure 3—figure supplement 2.

GD heatmaps are shown on the left, and FRD heatmaps are shown on the right. Column names for FRD correspond to the reference sample. Organ codes are blood (a), bile (b), right spleen (e), left spleen (f), right kidney (j), left kidney (k), right lung (n), left lung (o), caudate liver (v), right liver (w), left liver (x), and medial liver (y). By 1 dpi, populations in highly bottlenecked samples are largely unrelated to each other. The spleen and liver still possess modestly diverse populations and therefore have lower GD values. The ‘checkerboarding’ effect in the liver samples (v, w, x, y: bottom right) of mice 5 and 7 is due to expanded clones in the liver that increase genetic distance across all samples (asterisks). The FRD metric was in part designed to detect these events as comparisons with samples possessing clonal expansion events yielded both high GD and FRD, indicating that the underlying population is similar and diverse. The single exception was observed in the right lobe of mouse 7. The clonal expansion in this sample was so profound that the underlying population is indistinguishable from noise (see Figure 2).
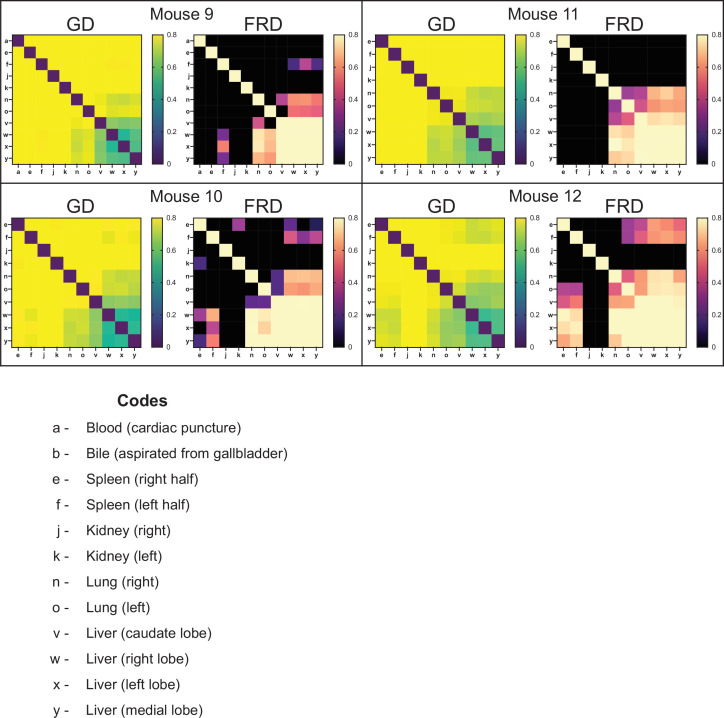
Figure 3—figure supplement 3. Genetic distance (GD) and fractional resilient genetic distance (FRD) 2 days post infection (dpi).

Figure 3—figure supplement 3.

GD heatmaps are shown on the left, and FRD heatmaps are shown on the right. Column names for FRD correspond to the reference sample. Organ codes are blood (a), bile (b), right spleen (e), left spleen (f), right kidney (j), left kidney (k), right lung (n), left lung (o), caudate liver (v), right liver (w), left liver (x), and medial liver (y). Most organs are now highly divergent (high GD), apart from the liver, where adjacent lobes share many tags and are diverse.
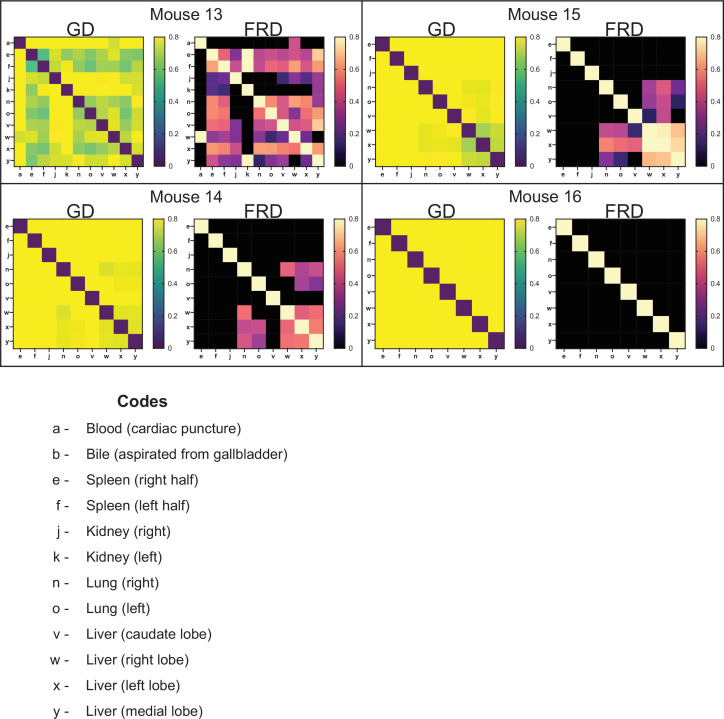
Figure 3—figure supplement 4. Genetic distance (GD) and fractional resilient genetic distance (FRD) 3 days post infection (dpi).

Figure 3—figure supplement 4.

GD heatmaps are shown on the left, and FRD heatmaps are shown on the right. Column names for FRD correspond to the reference sample. Organ codes are blood (a), bile (b), right spleen (e), left spleen (f), right kidney (j), left kidney (k), right lung (n), left lung (o), caudate liver (v), right liver (w), left liver (x), and medial liver (y). Relatedness between all organs has substantially decreased. Mouse 16 is the first animal where there is essentially no similarity between liver lobes, indicating that by 3 dpi clearance has completely segregated suborgan populations. The checkerboarding in mouse 13 is due to transferred clones. Moderate FRD values indicate that transferred populations comprise multiple clones, although underlying nontransferred populations are present as well.
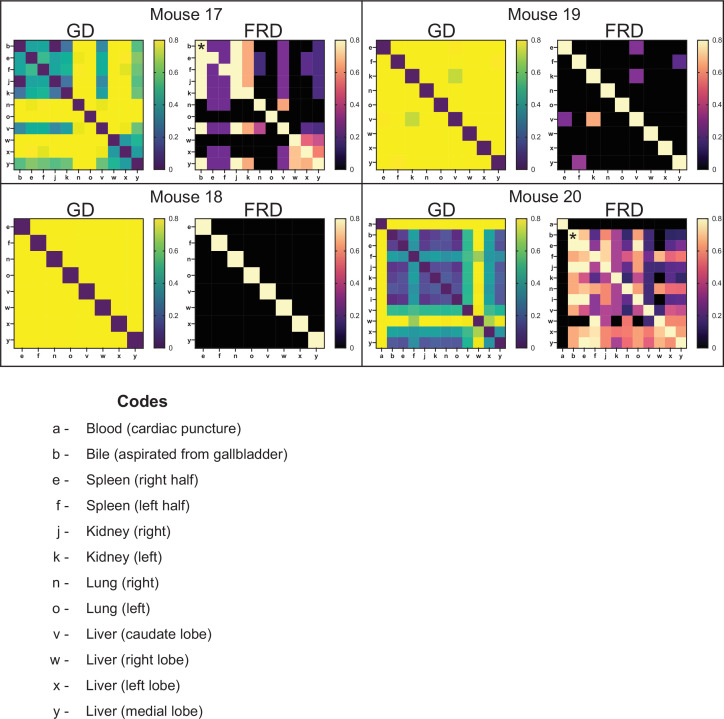
Figure 3—figure supplement 5. Genetic distance (GD) and fractional resilient genetic distance (FRD) 4 days post infection (dpi).

Figure 3—figure supplement 5.

GD heatmaps are shown on the left, and FRD heatmaps are shown on the right. Column names for FRD correspond to the reference sample. Organ codes are blood (a), bile (b), right spleen (e), left spleen (f), right kidney (j), left kidney (k), right lung (n), left lung (o), caudate liver (v), right liver (w), left liver (x), and medial liver (y). A clear dichotomy is observed between mice 18 and 19 versus mice 17 and 20. Mice 17 and 20 had substantial replication of bacteria in the bile. This clone spread across the body, indicated by low GD values in multiple organs. FRD values reflect the fact that the bile is a single clone. Starting at the asterisk, rightward movement on the FRD heatmap yields lower nonzero FRD values than downward movement. This indicates that when the non-bile organ is set as the reference, FRD values are low, revealing that only a few barcodes are shared. When the bile is set as the reference, FRD values are much higher, indicating that the shared clones represent a larger fraction of barcodes in the bile. This is quantified in Figure 3C. Given that the Nr of bile is ~1, low GD values are due to essentially a single clone.
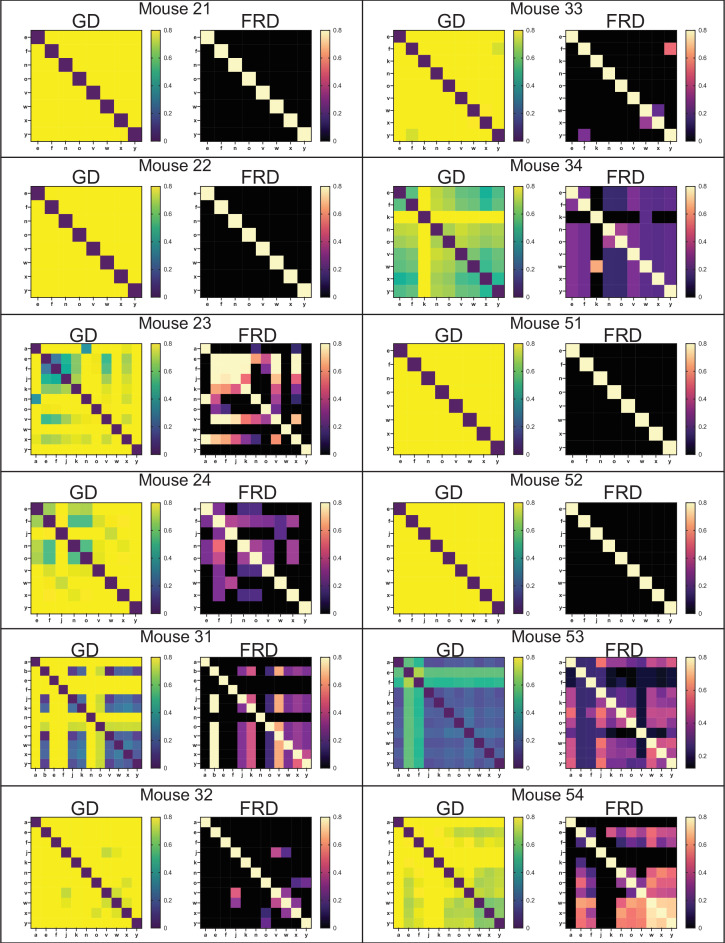
Figure 3—figure supplement 6. Genetic distance (GD) and fractional resilient genetic distance (FRD) 5 days post infection (dpi).

Figure 3—figure supplement 6.

GD heatmaps are shown on the left, and FRD heatmaps are shown on the right. Column names for FRD correspond to the reference sample. Organ codes are blood (a), bile (b), right spleen (e), left spleen (f), right kidney (j), left kidney (k), right lung (n), left lung (o), caudate liver (v), right liver (w), left liver (x), and medial liver (y). Mice 23, 24, 32, 33, and 52 had abscesses in at least one lobe of the liver. Mouse 31 had a clone apparently disseminated from bile. Mouse 53 had much higher blood CFU than others in the cohort. Note that most instances of sharing correspond to low FRD values, indicating that sharing is due to very few barcodes. A notable exception is the splenic samples of mouse 23, which are represented in Figure 2.